World Wealth Report 2019
3% global decrease in HNWI wealth driven by slump in equity markets and slowing regional economies with Asia-Pacific, and especially China, worst affected by accounting for 25% of the global market decline in 2018
Ultra-HNWIs[1] were the most affected and accounted for 75% of the overall HNWI wealth decline
As wealth industry evolves and HNWI expectations shift, key opportunities exist for wealth management firms to better meet rising client expectations around personalized offerings, service quality and fee transparency
Paris, July 9, 2019 – The World Wealth Report 2019 (WWR), published today by Capgemini, found that after seven years of continuous growth, overall global high net worth individual (HNWI) wealth declined by 3% in 2018. Largely due to a drop in wealth in the Asia-Pacific region (specifically China), this decline has resulted in a loss of 2 trillion USD worldwide. Despite this, wealth management firms maintained stable levels of customer trust and satisfaction throughout the year, though better personal relationships are still key for enhanced performance of firms which can be achieved through effective utilization of next-gen technologies.
Key findings of the report include:
Asia-Pacific leads global wealth decline, while Middle East wealth grew
The global HNWI population and wealth declined by 0.3% and 3% respectively, with Asia-Pacific hit the hardest. The region represented US$1 trillion of the global decline in wealth, as the HNWI population decreased by 2% and HNWI wealth by 5%. China alone was responsible for more than half (53%) of Asia-Pacific and more than 25% of global HNWI wealth loss.
Meanwhile, HNWI wealth declined across nearly all other regions: Latin America declined by 4%, Europe by 3% and North America by 1%. However, the Middle East bucked the trend, generating 4% growth in HNWI wealth and increasing its HNWI population by 6% due to strong GDP growth and financial market performance. Similar to the previous year, the markets with the largest HNWI populations – the United States, Japan, Germany, and China – represented 61% of the total global HNWI population.
Ultra-HNWIs record the greatest financial loss
The ultra-HNWI population declined by 4%, and their wealth declined by around 6%. This accounted for 75% of the total global wealth decrease. Mid-tier millionaires (HNWIs between US$5-30 million of wealth) made up 20% of the total decline. The millionaire-next-door segment (which represents HNWIs between US$1-5 million of wealth and makes up almost 90% of the HNWI population) was affected the least in 2018, as their wealth dipped by less than 0.5%, signifying that nearly all declines in HNWI wealth and population were driven by the higher wealth (ultra-HNWI and mid-tier millionaire) segments.
Cash tops equities as most held asset class
Asset allocations shifted significantly, as cash replaced equities to become the most held asset class in Q1 2019, representing 28% of HNWI financial wealth, while equities slipped to the second position at nearly 26% (a decline of 5 percentage points). Volatile equity market conditions spurred a slight increase in allocation towards alternative investments to 13%, a 4 percentage point increase from the previous year.
Trust levels remained stable but wealth managers must evolve the client experience
Despite declining wealth, HNWI’s year-over-year trust and satisfaction in wealth management firms increased by 3 percentage points over already high levels. However, the report revealed significant opportunity for wealth firms to proactively address rising HNWI expectations, as an unsatisfactory service experience was the biggest reason for HNWIs to switch firms in 2018. BigTechs[2] are expected to be one of the greatest industry disrupters due to their digital capabilities, particularly as fewer than 50%[3] of HNWI clients said they were satisfied with current mobile and online platforms, and 85% demanded more digital interaction when accessing portfolio information. At the same time, only 62% of HNWIs said they are comfortable with their primary wealth manager’s fees, with many demanding more personalized offerings that focus on greater value creation.
According to the report, investment in next-gen technologies will be critical in order to enhance the client experience. While there is consensus among firm executives and wealth managers that AI is a key game-changer, only 5% of surveyed firms said they had implemented AI strategies across all core areas. To support sustainable growth within this disruptive environment, firms must pursue the three key strategies of bridging value gaps for wealth managers and clients, redefining IT strategy and leveraging the integrated ecosystem.
“While the volatile economic environment of 2018 led to HNWI wealth decline globally, wealth managers have been extremely successful in maintaining strong levels of client trust,” said Anirban Bose, CEO of Capgemini’s Financial Services and Member of the Group Executive Board. “However, future success will depend on the agility of wealth management firms to evolve the client experience and find new ways to add value through more personalized services. Next-gen technology and closing expectation gaps will aid this, but the landscape is shifting so quickly that companies must not be afraid to overhaul their strategy and business models if needed.”
Report methodology
The World Wealth Report from Capgemini is the industry-leading benchmark for tracking high net worth individuals (HNWIs), their wealth and the global and economic conditions that drive change in the Wealth Management industry. This year’s 23rd annual edition includes findings from in-depth primary research on global HNWI’s perspectives and behaviors. Based on responses from more than 2,500 HNWIs across 19 major wealth markets in North America, Latin America, Europe and Asia-Pacific, the 2019 Global HNW Insights Survey explores HNWI investment behavior including HNWI trust and confidence, satisfaction, comfort level with fees, and personalized services. The survey also measured current HNWI investment behavioral patterns of global HNWIs, including their asset allocation preferences as well as the geographic allocations of their investments.
About Capgemini
A global leader in consulting, technology services and digital transformation, Capgemini is at the forefront of innovation to address the entire breadth of clients’ opportunities in the evolving world of cloud, digital and platforms. Building on its strong 50-year heritage and deep industry-specific expertise, Capgemini enables organizations to realize their business ambitions through an array of services from strategy to operations. Capgemini is driven by the conviction that the business value of technology comes from and through people. It is a multicultural company of over 200,000 team members in more than 40 countries. The Group reported 2018 global revenues of EUR 13.2 billion.
Visit us at www.capgemini.com. People matter, results count
[1] Ultra-HNWIs are defined as those who represent the top 1% of the HNWI population, per the definition above.
[2] BigTech is a general term for data-driven tech firms not traditionally present in Financial Services, such as Amazon, Google/Alphabet, Alibaba, Apple and Facebook.
[3] Globally, 42% and 46% HNWIs are satisfied with mobile and online platform respectively.
The World Wealth Report from Capgemini is the industry recognized benchmark for Wealth Management Trends. This year’s 22nd edition highlights the need for wealth management firms to accelerate hybrid transformation and transform budget approaches to deal with potential BigTech entry.
Key Findings
Capgemini’s World Wealth Report 2018 explores trends that affect high net worth individuals (HNWIs) in 71 countries, accounting for more than 98% of global gross national income and 99% of world stock market capitalization. Download a copy from our interactive website at www.worldwealthreport.com
Our 2018 findings reveal:
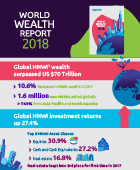
- Growth Continues as Global HNWI Wealth Breaks the US$70 Trillion Mark.Registering its sixth consecutive year of gains, HNWI wealth grew 10.6 percent, making 2017 the second-fastest year of HNWI growth since 2011.
- Wealth managers delivered another year of strong returns. According to the report, global HNWI investment returns (on the assets managed by wealth managers) were up 27.4 percent in 2017, with equities remaining the largest asset class in the first quarter of 2018 at 30.9 percent of HNWI financial wealth, cash and cash equivalents at 27.2 percent, and real estate at 16.8 percent (increase of 2.8 percentage points.)
- Robust investment returns are not increasing HNWI satisfaction. Global HNWI satisfaction did not meet 70% satisfaction levels, despite significant returns. In 2018, only 55.5 percent of HNWIs said they connected very well at a personal level with their wealth managers. Better personal connections between wealth managers and their HNW clients may lead to better HNWI satisfaction scores.
- Cryptocurrencies gained global attention in 2017.Cryptocurrency investments reached an all-time high, with total market capitalization peaking in January 2018. HNWIs are cautiously interested in holding cryptocurrencies, with 29.0% globally having a high degree of interest, and 26.9% saying they were somewhat interested.
- Wealth management firms must accelerate hybrid transformation and transform budget approaches to tackle significant hybrid demand from HNWIs and potential BigTech entry. Report reveals that 68.7% of HNWIs globally said hybrid advice is a significant factor regarding decisions related to asset consolidation with their primary wealth management firm. Additionnally, more than 50% of HNWIs expressed an interest in wealth management services offered by BigTech firms. To transform and drive hybrid innovation, leading firms are heavily investing in technologies such as intelligent automation and artificial intelligence.
The World Wealth Report 2018 is available for download at www.worldwealthreport.com.
The World Wealth Report Website
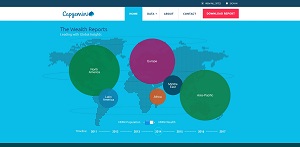
 For the complete story on global wealth trends, visit www.worldwealthreport.com. You will find dynamic graphs to explore HNWI data and trends across: market sizing of the HNWI population and wealth; HNWI asset and geographic allocations; and HNWI behavior across six regions.
Infographic
For details about the World Wealth Report 2018, visit www.worldwealthreport.com, follow #WWR18 or contact us at wealth@capgemini.com.


No comments:
Post a Comment