Trade finance distribution poised to grow to $3 trillion market for investors
- AuthorSanne Wass
Banks are increasingly distributing trade finance assets to institutional investors, helped by new technology and a growing interest in the asset class.
While Basel III capital requirements and other new regulations have prompted some banks to dial back their trade finance operations, others are looking to sell trade finance assets to new players to free up capacity to lend more.
Trade finance covers financial instruments that companies use to facilitate trade, such as letters of credit, performance guarantees, supply-chain finance and import/export loans.
HSBC Holdings PLC, one of the world's largest trade finance banks, is seeing an "unprecedented" level of interest from institutional investors in buying trade finance assets from the bank, said Surath Sengupta, its global head of trade portfolio management and distribution.
The distribution of trade finance assets to nonbank investors could to grow to a $3 trillion market in the next seven to 10 years, according to Tradeteq Ltd, a digital trade finance exchange.
Banks worldwide are seeing growth opportunities for their trade finance distribution business. The Trade Finance Distribution Initiative, a collaborative project started last year for banks and asset managers to develop market standards and trial new technology, now counts some of the world's biggest trade finance players as members, including Standard Chartered PLC, Deutsche Bank AG, Crédit Agricole SA and HSBC.
Traditionally bank to bank
"Every other bank product is already getting distributed, except for trade finance. That's why we believe that this is going to happen," said Christoph Gugelmann, co-founder and CEO of Tradeteq, which is the technology provider for the Trade Finance Distribution Initiative.
To date, trade finance distribution has primarily been a bank-to-bank market, with banks using it as a tool to manage country, sector and buyer limits between them.
Tradeteq estimates that of the some $7.5 trillion bank-intermediated trade finance in 2018, around $300 billion to $400 billion was distributed between the banks themselves, while less than $100 billion was sold to nonbank financial institutions.
Bringing institutional capital to the trade finance market is becoming ever more urgent. The trade finance gap, measured in rejected applications, is estimated by the Asian Development Bank to be between $1.4 trillion and $1.6 trillion.
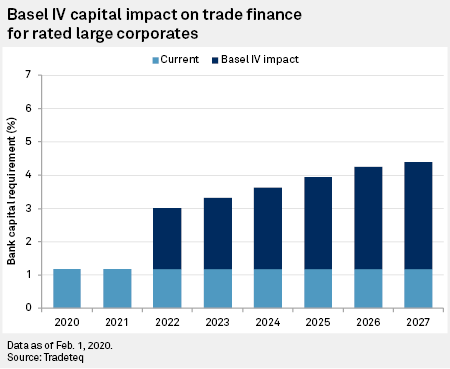
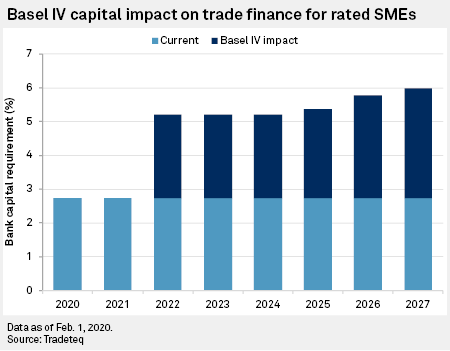
This may worsen as banks face higher capital requirements in 2022 as a result of Basel III reforms, commonly referred to as Basel IV, according to calculations by Tradeteq.
It found that the amount of capital that banks need to put aside when offering trade finance to SMEs will increase to 5% in 2022 and 6% in 2027, up from less than 3% today.
Low volatility
While a growing number of trade finance funds typically give investors access to trade finance deals otherwise rejected by banks, buying bank-originated trade finance is an appealing option for those seeking lower risk investments.
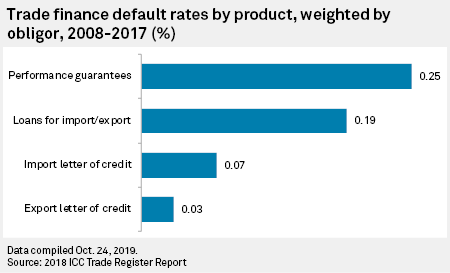
Default rates for bank-originated trade finance have historically been very low across products and regions, according to the International Chamber of Commerce, which analyzed 25 trade finance banks' transactions from 2008 to 2017.
Trade finance is also an attractive proposition for investors because if offers yield, low volatility and low correlation to other asset classes, said Christopher McGinley, head of trade finance at Federated Investors Inc.
The investment manager was one of the early entrants into trade finance in 2009, and now sources trade finance assets from 35 banks, McGinley said.
The approach allows investors to draw on banks' experience providing trade finance, while banks can expand their operations and uphold client relationships.
Sengupta said distribution enables HSBC to provide more trade finance where it has the appetite but might not have sufficient liquidity, particularly on large supply chain finance programs.
In 2019, HSBC distributed $28 billion worth of trade finance assets, up from $2 billion in 2015, he said. To grow this further, the bank recently partnered with Allianz Global Investors GmbH to launch a capital fund that will buy and wrap HSBC assets into notes and offer them to clients.
Read more: Trade finance funds grow as investors seek 'recession-proof' asset class
Sengupta rejected concerns that banks are selling off assets they deem too risky. "Our skin is always in the game. Most of the time we have the largest holding among all investors," he said.
Phone calls and Excel sheets
But bringing new players into a market dominated by banks for centuries comes with its challenges.
One barrier is the lack of education among institutional investors about trade finance being an investable asset class, McGinley said.
Another hurdle is that trade finance is a paper-based and manual business. Distribution of assets typically happens on a bilateral basis, managed through phone calls and Excel sheets. The process of finding a buyer or seller, negotiating price, agreeing terms and closing a deal can take months, if not years using traditional distribution methods, according to Tradeteq.
"There is certainly a place for technology to make trade finance more accessible and efficient," said McGinley.
New platforms such as LiquidX Inc., CCRManager Pte. Ltd. and Tradeteq are attempting to do just that, and they may be crucial for the trade finance distribution market to take off.
Such technology solutions allow investors to increasingly buy trade finance assets digitally, on a transactional basis, and from multiple counterparties, rather than having to enter into long-term securitization programs with one bank.
ESG Investing is Becoming Critical for Credit Risk and Portfolio Management Professionals
- AuthorGiorgio Baldassarri
- ThemeESG
- SegmentBankingInvestment BankingInvestment Management
- TagsGlobal
At the end of 2019, we undertook a survey of 194 credit risk professionals working in financial services firms around the world to see how their portfolio management processes have been evolving to account for environmental, social, and governance factors (ESG). The results were very interesting, reflecting the incredible surge that is being reported in global sustainable investments, which reached a new peak of $30.683 trillion USD at the beginning of 2018.[1]

ESG covers a wide range of issues, including how corporations take steps to help manage climate change, provide for their workers, protect relationships with business partners, and build a culture of innovation. Heightened investor demand is making it critical to consider these factors more fully in credit risk analysis, according to 86% of our survey respondents. Given this, 83% say ESG factors are integral to what they do today, or are playing a growing role in the credit risk area.
Financial services firms seem to be formalizing their approach to ESG issues, with most (89%) respondents saying their organization has an explicit ESG policy in place. In addition, almost half (46%) have a dedicated ESG resource in the Credit Risk team, with plans to beef up this talent going forward. This includes creating dedicated ESG-responsible positions, training incumbent professionals in ESG principles and best practices, and hiring new ESG talent from non-financial backgrounds, such as sustainability consultancies and non-governmental organizations.
So what is driving this change? Improved long-term returns leads the list as one of the top three motivators for incorporating ESG into the portfolio management process, with growing evidence that ESG investing can, in fact, have a positive impact on financial performance.[2] Brand image/reputation was also mentioned by over half (55%) of the respondents, thinking that negative press about ESG issues may damage their company’s reputation and profitability.
A large number of respondents (76%) have ESG tools and models in place today, with APAC leading the charge (86% of respondents). More needs to be done, however, as firms strive to find broader data sources, more robust analytical capabilities, and experienced personnel. This includes looking at new machine-learning/Artificial Intelligence (AI) systems in support of ESG credit risk management, which may enable investors to collect and analyze more information than ever before when accounting for ESG risks and opportunities, according to S&P Global.[3]

Download the full report to gain insights on the state of ESG credit risk management within financial organizations today.
[1] The Global Sustainable Investment Alliance's 2018 biennial report, released April 1, 2019.
[2] “The PRI ESG and alpha study”, the PRI, March 2018.
[3] “How can AI help ESG investing?”, S&P Global, as of January 28, 2020, www.spglobal.com/en/research-insights/articles/how-can-ai-help-esg-investing.
Factor ESG into your credit risk analysis
Request Demo
Part Two IFRS 9 Blog Series Time is Running Out for Insurance Companies to Comply
As we discussed in our first IFRS 9 blog, the financial crisis of 2007-2008 underscored the need to better understand an organization’s expected credit losses (ECLs). International Financial Reporting Standard 9 (IFRS 9) was put in place as a result to address perceived deficiencies in the accounting for financial instruments. Have you taken the steps needed to comply with the required changes? If not, the clock is ticking.
The Need to Upgrade Analytical Tools
Insurance companies should consider analytical tools for IFRS 9 that are robust, efficient, and transparent. In this blog, we will focus on the need for robustness. ECLs are typically generated by the estimation of three elements: (1) Probabilities of Default (PD) – a view on the probability that a bond issuer will not pay when due, (2) Loss Given Default (LGD) – a view on post-default recovery prospects, and (3) Exposure at Default (EAD) – the total value claimed by the holder of the bond against the issuer. Our approach aims to generate robust estimates in all three cases.
- 1. PD Estimation
PD estimation is particularly challenging given the need to have a point-in-time (PIT) view of default risk, which is forward looking until a bond matures. Matters are further complicated by data scarcity. Asset classes to which insurers are typically exposed are considered low-default portfolios, where the number of historical defaults are very low or non-existent. The latter is the case for bonds issued by sovereigns, regional governments, banks, insurers, and large corporates. For example, no sovereign rated higher than “BBB-” has ever defaulted over a one-year period, with almost all defaults occurring in emerging markets. This renders PD estimation exceptionally difficult.
S&P Global Market Intelligence has addressed these difficulties via the following steps:
- 1. Determine the public rating assigned by S&P Global Ratings as the starting point.
- 2. Assign a long-term or through-the-cycle (TTC) term structure to the PD based on over 40 years of historical S&P Global Ratings default data.
- 3. Transform TTC PD term structure to a PIT PD term structure using the S&P Global Market Intelligence proprietary Credit Cycle Projection Overlay (see figure below). This utilises six macroeconomic and market factors to estimate the current and projected future movements of country- and sector-specific economic and credit cycles.

Source: S&P Global Market Intelligence. For illustrative purposes only.
The above process is grounded in rich historical data, whilst reflecting our deep and broad experience in credit analysis, leading to robust bond-specific estimates of PDs.
- 2. LGD Estimation
LGD estimation is considered more difficult than the estimation of PD. Many institutions struggle with developing sound methodologies, with most settling on the use of average historical losses as indicators of future expected losses. This simplified approach is not well suited for IFRS 9 purposes as averages, by definition, are not PIT nor supported by empirical evidence.

Source: LossStats™ Model, S&P Global Market Intelligence. Data as of September 11, 2019.
S&P Global Market Intelligence introduced sector-specific LGD Scorecards over 15 years ago. These Scorecards are driven by a mix of S&P Global LGD experience and market data. We have also undertaken robust testing of our LGD solutions by backtesting on over 2,000 defaulted bonds issued by sovereigns, banks, insurers and corporates, with our approach reliably predicating the loss severity for approximately 1,400 bonds. Furthermore, the average difference between the point estimate predicated by our approach and the actual loss incurred is less than 1.5%.

|
Given LGD does vary continuously from 0% to over 100% (including allowable recovery costs), these levels of reliability provide confidence for those looking to obtain robust LGD estimates to satisfy regulators, auditors, and stakeholders.
- 3. EAD Estimation
The EAD approach is dependent on the type of investments under analysis and is often rules-based, driven by the insurer. S&P Global Market Intelligence provides guidance on this topic to help insurers implement intuitive and data-driven rules.
Maintaining High Standards – Ongoing Update and Maintenance
Our team is focused on building robust credit solutions, as well as nurturing and enhancing these solutions so they continue to meet the ever-increasing demands of our clients. This is achieved by way of our update and maintenance service, where a dedicated team delivers up-to-date data and analytics (e.g., macroeconomic forecasts) throughout the year.
To learn more about our robust, efficient, and transparent IFRS 9 offering, contact us here.
No comments:
Post a Comment