POLITICS
The Pension Time Bomb: $400 Trillion by 2050
Published
2 years agoon
April 16, 2018View a high resolution version of this graphic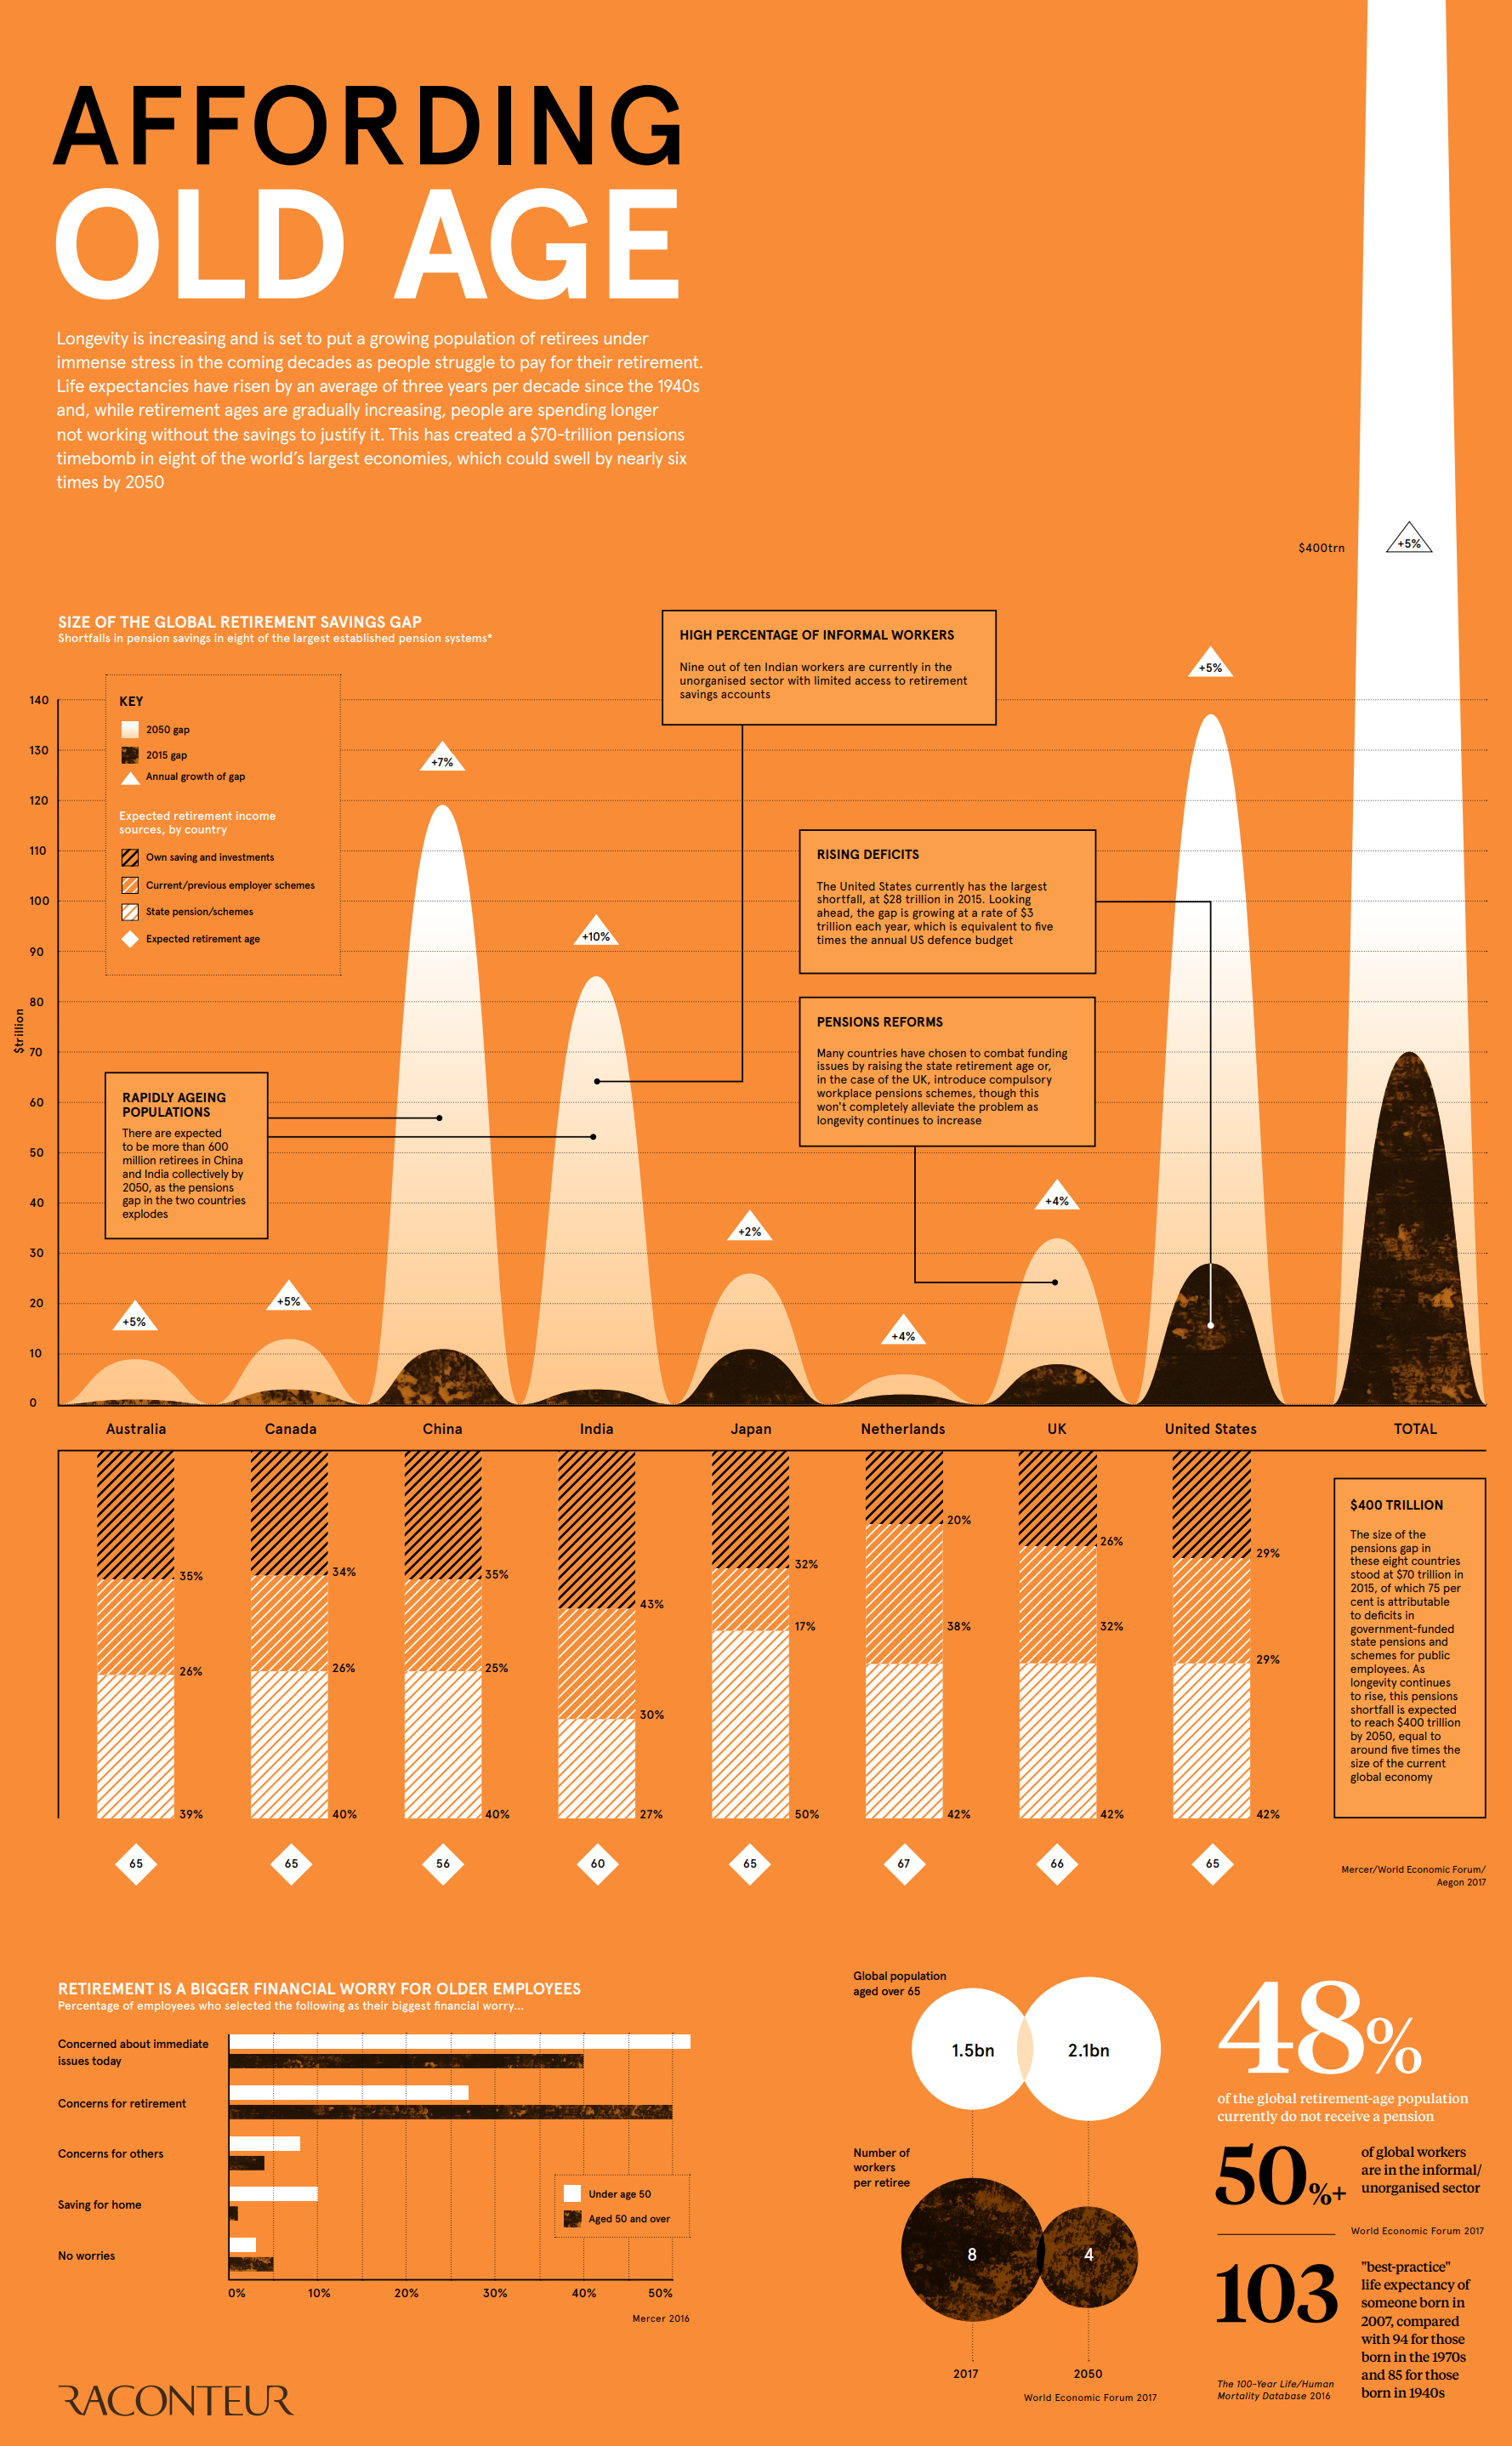
The Pension Time Bomb: $400 Trillion by 2050
View the high resolution version of today’s graphic by clicking here.
Are governments making promises about pensions that they might not be able to keep?
According to an analysis by the World Economic Forum (WEF), there was a combined retirement savings gap in excess of $70 trillion in 2015, spread between eight major economies..
The WEF says the deficit is growing by $28 billion every 24 hours – and if nothing is done to slow the growth rate, the deficit will reach $400 trillion by 2050, or about five times the size of the global economy today.
The group of economies studied: Canada, Australia, Netherlands, Japan, India, China, the United Kingdom, and the United States.
Mind the Gap
Today’s infographic comes to us from Raconteur, and it illuminates a growing problem attached to an aging population (and those that will be supporting it).
Since social security programs were initially developed, the circumstances around work and retirement have shifted considerably. Life expectancy has risen by three years per decade since the 1940s, and older people are having increasingly long life spans. With the retirement age hardly changing in most economies, this longevity means that people are spending longer not working without the savings to justify it.
This problem is amplified by the size of generations and fertility rates. The population of retirees globally is expected to grow from 1.5 billion to 2.1 billion between 2017-2050, while the number of workers for each retiree is expected to halve from eight to four over the same timeframe.
The WEF has made clear that the situation is not trivial, likening the scenario to “financial climate change”:
The anticipated increase in longevity and resulting ageing populations is the financial equivalent of climate change
Michael Drexler, Head of Financial and Infrastructure Systems, WEF
Like climate change, some of the early signs of this retirement savings gap can be “sandbagged” for the time being – but if not handled properly in the medium and long term, the adverse effects could be overwhelming.
Future Proofing
While implementing various system reforms like raising the retirement age will help, ultimately the money in the system has to come from somewhere. Social security programs will need to cut benefits, increase taxes, or borrow from somewhere else in the government’s budget to make up for the coming shortfalls.
In the United States specifically, it is expected that the Social Security trust fund will run out by 2034. At that point, there will only be enough revenue coming in to pay out approximately 77% of benefits.
YOU MAY LIKE
Ranked: The Best and Worst Pension Plans, by Country
The Problem of an Aging Global Population, Shown by Country
Visualizing Global Attitudes Towards Retirement
Here’s How to Become a 401(k) Millionaire
What Your 401(k) Provider Doesn’t Want You to Know

How Wall Street Fools You Into Overpaying for Underperformance
POLITICS
Mapped: The Countries With the Most Military Spending
Global military spending surpassed $1.9 trillion in 2019, but nearly 75% of this total can be traced to just 10 countries.
Published
1 week agoon
September 24, 2020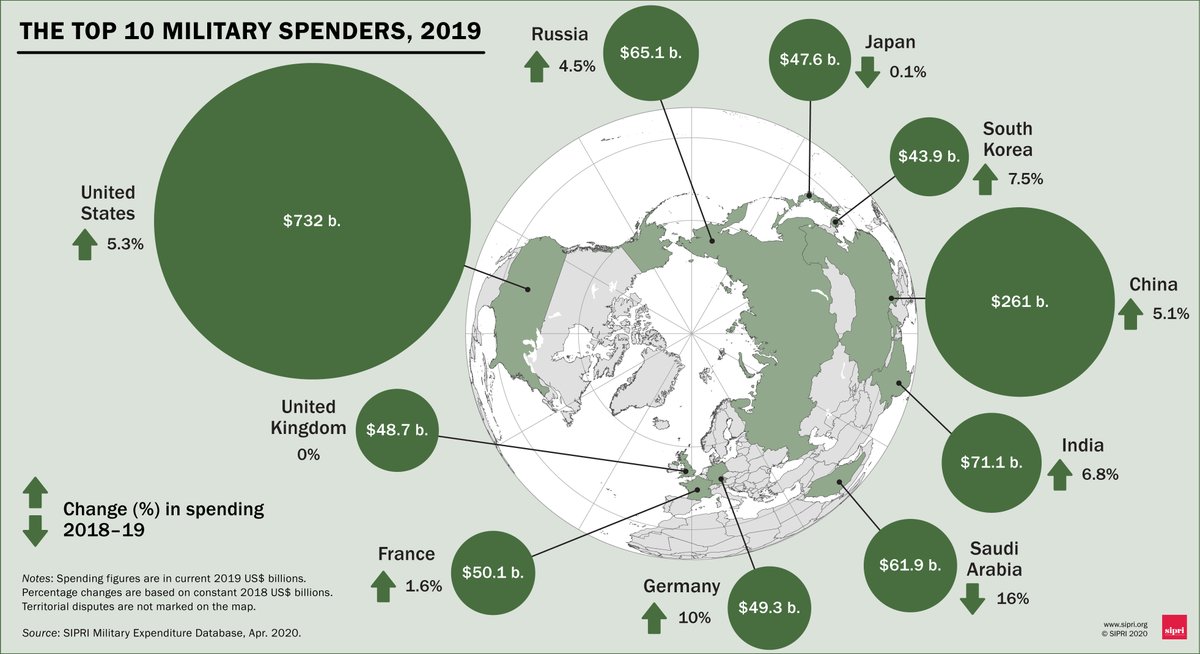
Mapped: The Countries With the Most Military Spending
Whether it’s fight or flight, there’s a natural tendency of humans to want to protect themselves.
In this day and age, this base instinct takes the form of a nation’s expenditures on armies and armaments, towards an end goal of global security and peacekeeping.
This graphic from the Stockholm International Peace Research Institute (SIPRI) delves into the top military spenders as of 2019.
Top 10 Biggest Military Spenders
Let’s first take a look at the overall growth trends. The world’s military spending grew by 3.6% year-over-year (YoY)—currently the highest rate this decade—to surpass $1.9 trillion in 2019.
While just 10 countries are responsible for nearly 75% of this amount, the U.S. alone made up the lion’s share with 38% of the global total. In fact, its YoY rise in spending alone of $49.2 billion rivals Germany’s entire spending for the same year.
Naturally, many questions rise about where this money goes, including the inevitable surplus of military equipment, from night vision goggles to armored vehicles, that trickles down to law enforcement around the nation.
Here’s how world’s top 10 military spenders compare against each other:
| Country | Military Spending ('19) | YoY % change | Military Spending as % of GDP ('19) |
|---|---|---|---|
U.S.  | $731.8B | +5.3% | 3.4% |
China  | $261.1B | +5.1% | 1.9% |
India  | $71.1B | +6.8% | 2.4% |
Russia  | $65.1B | +4.5% | 3.9% |
Saudi Arabia  | $61.2B | -16.0% | 8.0% |
France  | $50.1B | +1.6% | 1.9% |
Germany  | $49.3B | +10.0% | 1.3% |
UK  | $48.7B | 0.0% | 1.7% |
Japan  | $47.6B | -0.1% | 0.9% |
South Korea  | $43.9B | +7.5% | 2.7% |
| Global Total | $1.92T | +3.6% | 2.2% |
China and India, currently embroiled in a border dispute, have upped the ante for military spending in Asia. India is also involved in clashes with its neighbor Pakistan for territorial claim over Kashmir—one of the most contested borders in the world.
India’s tensions and rivalry with both Pakistan and China are among the major drivers for its increased military spending.
—Siemon T. Wezeman, SIPRI Senior Researcher
Germany leads among the top spenders in terms of highest YoY military spending increases. According to SIPRI, this is a preemptive measure in the face of perceived growing Russian threats.
These concerns may not be unfounded, considering that Russia comes in fourth for defense expenditures on the global stage—and budgets more towards military spending than any country in Europe, at 3.9% of its total GDP.
Military Spending as a Share of GDP
Looking more closely at the numbers, it’s clear that some nations place a higher value on defense than others. A country’s military expenses as a share of GDP is the most straightforward expression of this.
How do the biggest spenders change when this measure is taken into consideration?
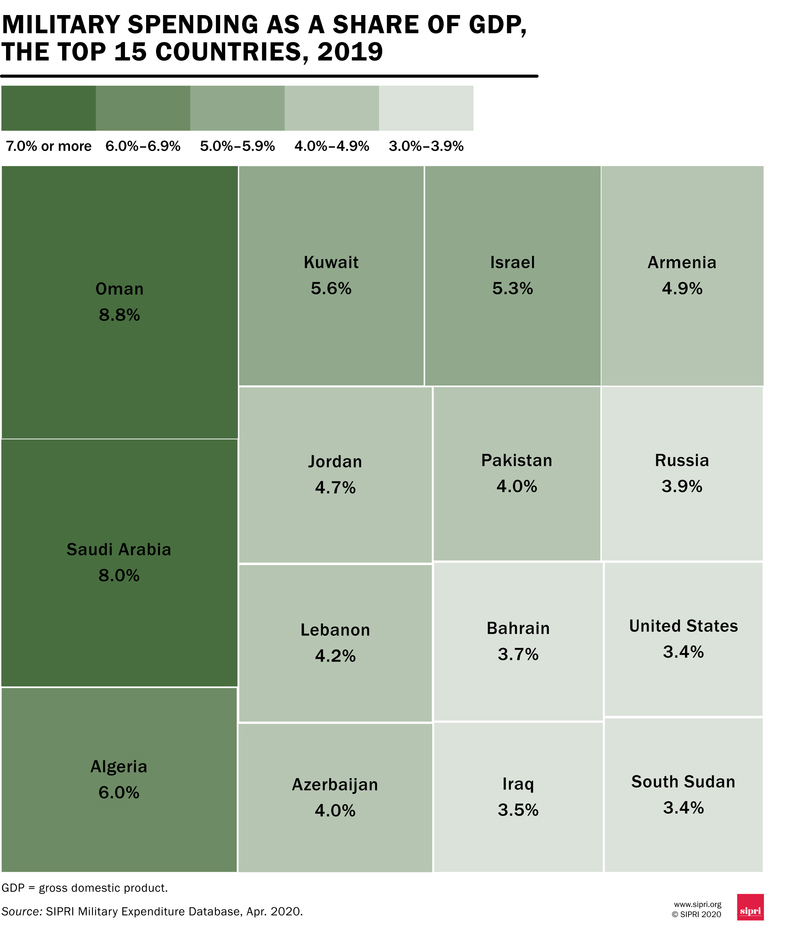
Eight of the 15 countries with the highest military spending as a percentage of GDP are concentrated in the Middle East, with an average allocation of 4.5% of a nation’s GDP.
It’s worth noting that data is missing for various countries in the Middle East, such as Yemen, which has been mired in a civil war since 2011. While SIPRI estimates that combined military spending in the region fell by 7.5% in 2019, these significant data gaps mean that such estimates may not in fact line up with the reality.
Explore the full data set of all available countries below.
| Country | 2019 Spending, US$B | 2019 Share of GDP |
|---|---|---|
| U.S. | $731.75 | 3.4% |
| China | $261.08 | 1.9% |
| India | $71.13 | 2.4% |
| Russia | $65.10 | 3.9% |
| Saudi Arabia | $61.87 | 8.0% |
| France | $50.12 | 1.9% |
| Germany | $49.28 | 1.3% |
| UK | $48.65 | 1.7% |
| Japan | $47.61 | 0.9% |
| South Korea | $43.89 | 2.7% |
POLITICS
Basic Income Experiments Around the World
Amid the pandemic, the idea of Universal Basic Income has been gaining steam with policymakers. Where has it been tried, and has it worked?
Published
2 weeks agoon
September 18, 2020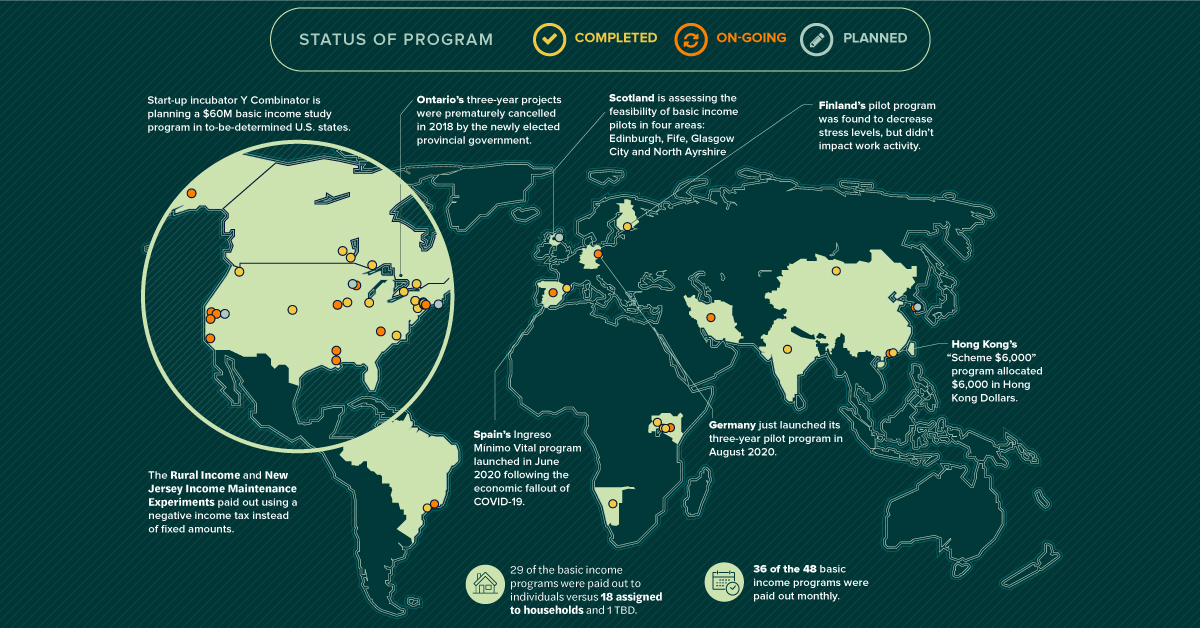
Basic Income Experiments Around the World
What if everyone received monthly payments to make life easier and encourage greater economic activity? That’s the exact premise behind Universal Basic Income (UBI).
The idea of UBI as a means to both combat poverty and improve economic prospects has been around for decades. With the COVID-19 pandemic wreaking havoc on economies worldwide, momentum behind the idea has seen a resurgence among certain groups.
Of course, the money to fund basic income programs has to come from somewhere. UBI relies heavily on government budgets or direct funding to cover the regular payments.
As policymakers examine this trade-off between government spending and the potential benefits, there is a growing pool of data to draw inferences from. In fact, basic income has been piloted and experimented on all around the world—but with a mixed bag of results.
What Makes Basic Income Universal?
UBI operates by giving people the means to meet basic necessities with a regular stipend. In theory, this leaves them free to spend their money and resources on economic goods, or searching for better employment options.
Before examining the programs, it’s important to make a distinction between basic income and universal basic income.

With these parameters in mind, and thanks to data from the Stanford Basic Income Lab, we’ve mapped 48 basic income programs that demonstrate multiple features of UBI and are regularly cited in basic income policy.
Some mapped programs are past experiments used to evaluate basic income. Others are ongoing or new pilots, including recently launched programs in Germany and Spain.
Recently, Canada joined the list as countries considering UBI as a top policy priority in a post-COVID world. But as past experiments show, ideas around basic income can be implemented in many different ways.
Basic Income Programs Took Many Forms
Basic income pilots have seen many iterations across the globe. Many paid out in U.S. dollars, while others chose to stick with local currencies (marked by an asterisk for estimated USD value).
| Program | Location | Recipients | Payment Frequency | Amount ($US/yr) | Dates |
|---|---|---|---|---|---|
| Abundant Birth Project | San Francisco, U.S. | 100 | Monthly | $12,000-$18,000 | TBD |
| Alaska Permanent Fund Dividend | Alaska, U.S. | 667,047 | Annually | $1,000-$2,000 | 1982-Present |
| B-MINCOME | Barcelona, Spain | 1,000 | Monthly | $1,392-$23,324* | 2017-2019 |
| Baby's First Years | New York, U.S. | 1,000 | Monthly | $240-$3,996 | 2017-2022 |
| Baby's First Years | New Orleans, U.S. | 1,000 | Monthly | $240-$3,996 | 2017-2022 |
| Baby's First Years | Omaha, U.S. | 1,000 | Monthly | $240-$3,996 | 2017-2022 |
Many of the programs meet the classical requirements of UBI. Of the 48 basic income programs tallied above, 75% paid out monthly, and 60% were paid out to individuals.
However, for various reasons, not all of these programs follow UBI requirements. For example, 38% of the basic income programs were paid out to households instead of individuals, and many programs have paid out in lump sums or over varying time frames.
Interestingly, the need for better understanding of basic income has resulted in many divergences between programs. Some programs were only targeted at specific groups like South Korea’s Basic Income for Farmers program, while others like the Baby’s First Years program in the U.S. have been experimenting with different dollar amounts in order to evaluate efficiency.
Other experiments based payments made off of the total income of recipients. For example, in the U.S., the Rural Income and New Jersey Income Maintenance Experiments paid out using a negative income tax (return) on earnings, while recipients of Canada’s Ontario Basic Income Pilot received fixed amounts minus 50% of their earned income.
Varying Programs with Varied Results
So is basic income the real deal or a pipe dream? The results are still unclear.
Some, like the initial pilots for Uganda’s Eight program, were found to result in significant multipliers on economic activity and well-being. Other programs, however, returned mixed results that made further experimentation difficult. Finland’s highly-touted pilot program decreased stress levels of recipients across the board, but didn’t positively impact work activity.
The biggest difficulty has been in keeping programs going and securing funding. Ontario’s three-year projects were prematurely cancelled in 2018 before they could be completed and assessed, and the next stages of Finland’s program are in limbo.
Likewise in the U.S., start-up incubator Y Combinator has been planning a $60M basic income study program, but can’t proceed until funding is secured.
A Post-COVID Future for UBI?
In light of COVID-19, basic income has once again taken center stage.
Many countries have already implemented payment schemes or boosted unemployment benefits in reaction to the pandemic. Others like Spain have used that momentum to launch fully-fledged basic income pilots.
It’s still too early to tell if UBI will live up to expectations or if the idea will fizzle out, but as new experiments and policy programs take shape, a growing amount of data will become available for policymakers to evaluate.
POPULAR
 TECHNOLOGY2 months ago
The World’s Tech Giants, Ranked by Brand Value
 TECHNOLOGY2 months ago
AIoT: When Artificial Intelligence Meets the Internet of Things
 TECHNOLOGY1 month ago
Visualizing the Social Media Universe in 2020
 TECHNOLOGY3 weeks ago
Here’s What Happens Every Minute on the Internet in 2020
 TECHNOLOGY1 month ago
Ranked: The Most Popular Websites Since 1993
 DEMOGRAPHICS1 month ago
The World Population in 2100, by Country
 BUSINESS2 months ago
From Bean to Brew: The Coffee Supply Chain
 MARKETS2 months ago
The 20 Most and Least Profitable Companies, Per Employee


