MONEY
Ranked: The World’s Richest Families in 2020
Published
4 weeks agoon
September 3, 2020By
Carmen Ang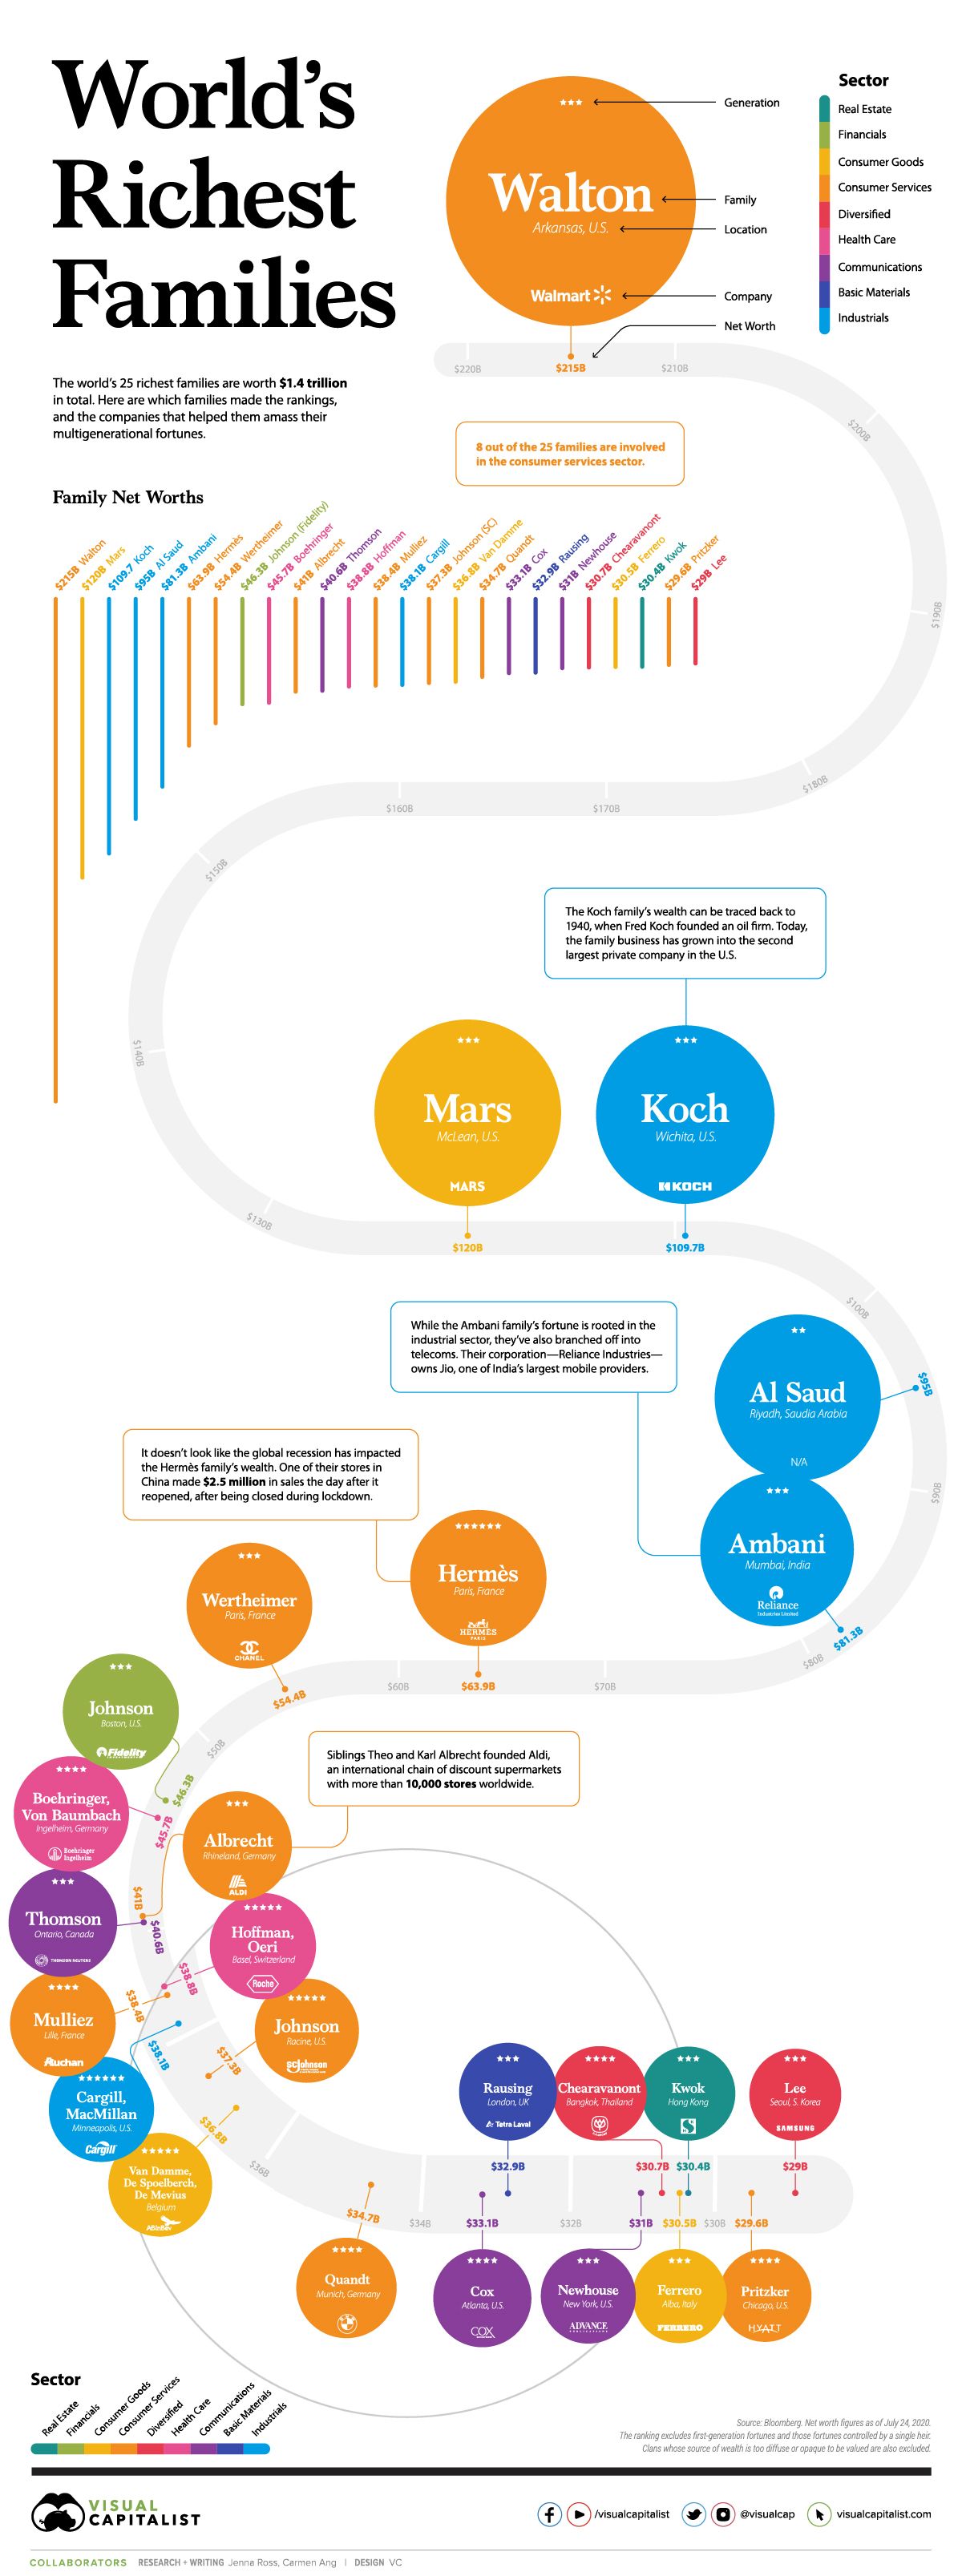
The World’s Richest Families in 2020
The COVID-19 pandemic hasn’t stopped the world’s wealthiest families from growing their fortunes. Over the past year, the richest family—the Waltons—grew their wealth by $25 billion, or almost $3 million per hour.
This graphic, using data from Bloomberg, ranks the 25 most wealthy families in the world. The data excludes first-generation wealth and wealth controlled by a single heir, which is why you don’t see Jeff Bezos or Bill Gates on the list. Families whose source of wealth is too diffused or opaque to be valued are also excluded.
The Full Breakdown
Intergenerational wealth is a powerful thing. It often prevails through market crashes, social turmoil, and economic uncertainty, and this year has been no exception.
Here’s a look at the 25 most wealthy families in 2020:
| Rank | Name | Company | Wealth, $B | Sector | Location |
|---|---|---|---|---|---|
| 1 | Walton | Walmart | 215 | Consumer services |  Bentonville, Arkansas Bentonville, Arkansas |
| 2 | Mars | Mars | 120 | Consumer goods |  McLean, Virginia McLean, Virginia |
| 3 | Koch | Koch Industries | 109.7 | Industrials |  Wichita, Kansas Wichita, Kansas |
| 4 | Al Saud | N/A | 95 | Industrials |  Riyadh, Saudi Arabia Riyadh, Saudi Arabia |
| 5 | Ambani | Reliance Industries | 81.3 | Industrials |  Mumbai, India Mumbai, India |
| 6 | Hermès | Hermès | 63.9 | Consumer services |  Paris, France Paris, France |
| 7 | Wertheimer | Chanel | 54.4 | Consumer services |  Paris, France Paris, France |
| 8 | Johnson (Fidelity) | Fidelity Investments | 46.3 | Financials |  Boston, New York Boston, New York |
| 9 | Boehringer, Von Baumbach | Boehringer Ingelheim | 45.7 | Health care |  Inglheim, Germany Inglheim, Germany |
| 10 | Albrecht | Aldi | 41 | Consumer services |  Rhineland, Germany Rhineland, Germany |
*Note: The Al Saud’s net worth is based on cumulative payouts royal family members were estimated to have received over the past 50 years.
The Waltons are the richest family on the list by far, with a net worth of $215 billion—that’s $95 billion more than the second wealthiest family. Sam Walton, the family’s patriarch, founded Walmart in 1962. Since then, it’s become the world’s largest retailer by revenue.
When Sam passed away in 1992, his three children—James, Alice, and Rob—inherited his fortune. Now, the trio co-owns about half of Walmart.
In second place is the Mars family, with a net worth of $120 billion. The family is well-known for their candy empire, but interestingly, about half of the company’s value comes from pet care holdings. Mars Inc. owns several popular pet food brands, including Pedigree, Cesar, and Royal Canin—and it expanded its pet presence further in 2017 when it acquired VCA, a company with almost 800 small animal vet hospitals across the U.S. and Canada.
The Koch family is the world’s third-richest family. Their fortune is rooted in an oil firm founded by Fred C. Koch. Following Fred’s death in 1967, the firm was inherited by his four sons—Frederick, Charles, David, and William. After a family feud, Frederick and William left the business, and Charles and David went on to build the mega industrial conglomerate known as Koch Industries.
Despite being affected by the oil crash this year, the Koch family’s wealth still sits at $109.7 billion. Before David’s passing in 2019, he and his brother Charles were heavily involved in politics—and their political efforts were the subject of much scrutiny.
Richest Families, by Sector
It’s important to note that many of these families have diversified their investments across a variety of industries. For instance, while the Koch family’s wealth is largely concentrated in the industrial sector and commodities, they also dabble in real-estate—in May 2020, they made a $200 million bet on U.S. rental homes.
That being said, it’s interesting to see where each of these families started, and which sectors have bred the highest number of ultra-wealthy families.
Here’s a breakdown of each sector and how many families on the list got started in them:
| Sector | Number of Families | Total Wealth, $B |
|---|---|---|
| Consumer Services | 8 | 514.3 |
| Industrials | 4 | 324.1 |
| Consumer Goods | 3 | 187.3 |
| Communications | 3 | 104.7 |
| Health Care | 2 | 84.5 |
| Diversified | 2 | 59.7 |
| Financials | 1 | 46.3 |
| Basical Materials | 1 | 32.9 |
| Real Estate | 1 | 30.4 |
The top sector is consumer services—8 of the 25 families are heavily involved in this sector. Walmart helped generate the most wealth out of families in this space, while luxury brands Hermès and Chanel were the source of fortune for the next two wealthiest families.
Industrial is the second largest sector, with 4 of the 25 families involved. It’s also one of the most lucrative sectors—out of the top five wealthiest families on the list, three are in industrials. The Koch family is the wealthiest family in this category, followed by the Al Saud family and the Ambani family, respectively.
Communications and consumer goods are tied for third, with 3 of the 25 families in each. The Thomsons, who founded Thomson Reuters, are the wealthiest family in communications, while the Mars family has the highest net worth in the consumer goods sector.
Resilient, but not Bulletproof
Despite a global recession, most of the world’s wealthiest families seem to be doing just fine—however, not everyone on the list has been thriving this year.
The Koch family’s fortune dropped by $15 billion from 2019 to 2020, and the current political climate in Hong Kong has had a negative impact on the Kwok family’s real estate empire.
While intergenerational wealth certainty has resilience, how much economic and social turmoil can it withstand? It’ll be interesting to see which families make the list in 2021.
YOU MAY LIKE
All of the World’s Money and Markets in One Visualization

Making Billions: The Richest People in the World
Mapped: The World’s Ultra-Rich, by Country
Mapped: The Wealthiest Person in Every U.S. State in 2020
Silver Series: Perfect Storm for Silver (Part 2 of 3)
All of the World’s Wealth in One Visualization
POLITICS
Basic Income Experiments Around the World
Amid the pandemic, the idea of Universal Basic Income has been gaining steam with policymakers. Where has it been tried, and has it worked?
Published
2 weeks agoon
September 18, 2020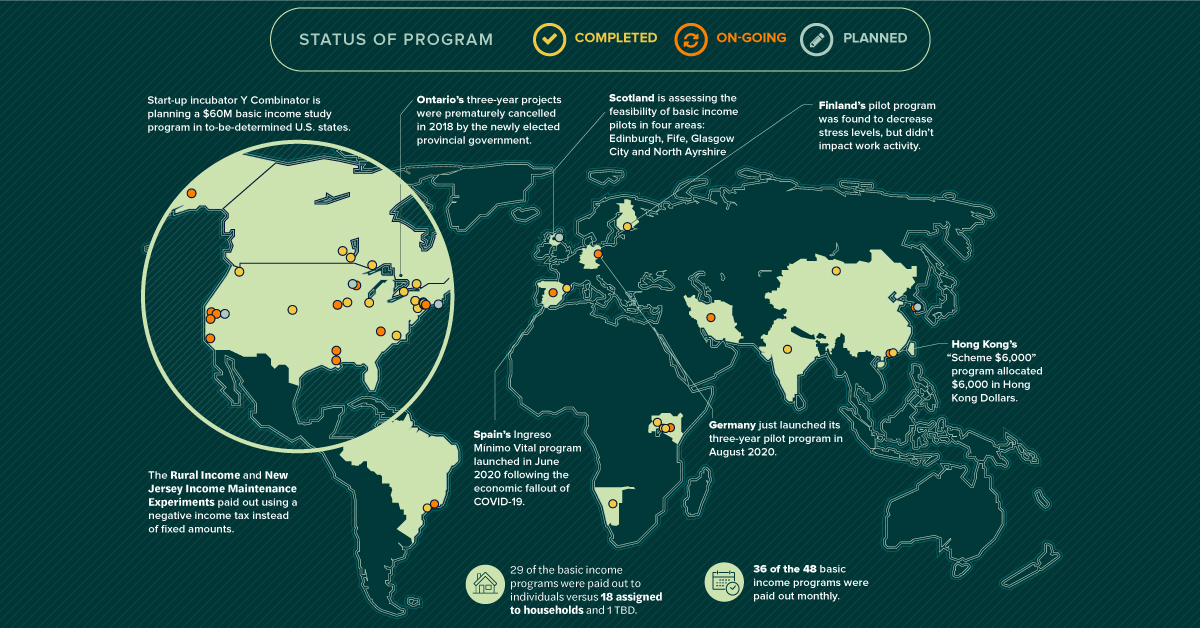
Basic Income Experiments Around the World
What if everyone received monthly payments to make life easier and encourage greater economic activity? That’s the exact premise behind Universal Basic Income (UBI).
The idea of UBI as a means to both combat poverty and improve economic prospects has been around for decades. With the COVID-19 pandemic wreaking havoc on economies worldwide, momentum behind the idea has seen a resurgence among certain groups.
Of course, the money to fund basic income programs has to come from somewhere. UBI relies heavily on government budgets or direct funding to cover the regular payments.
As policymakers examine this trade-off between government spending and the potential benefits, there is a growing pool of data to draw inferences from. In fact, basic income has been piloted and experimented on all around the world—but with a mixed bag of results.
What Makes Basic Income Universal?
UBI operates by giving people the means to meet basic necessities with a regular stipend. In theory, this leaves them free to spend their money and resources on economic goods, or searching for better employment options.
Before examining the programs, it’s important to make a distinction between basic income and universal basic income.

With these parameters in mind, and thanks to data from the Stanford Basic Income Lab, we’ve mapped 48 basic income programs that demonstrate multiple features of UBI and are regularly cited in basic income policy.
Some mapped programs are past experiments used to evaluate basic income. Others are ongoing or new pilots, including recently launched programs in Germany and Spain.
Recently, Canada joined the list as countries considering UBI as a top policy priority in a post-COVID world. But as past experiments show, ideas around basic income can be implemented in many different ways.
Basic Income Programs Took Many Forms
Basic income pilots have seen many iterations across the globe. Many paid out in U.S. dollars, while others chose to stick with local currencies (marked by an asterisk for estimated USD value).
| Program | Location | Recipients | Payment Frequency | Amount ($US/yr) | Dates |
|---|---|---|---|---|---|
| Abundant Birth Project | San Francisco, U.S. | 100 | Monthly | $12,000-$18,000 | TBD |
| Alaska Permanent Fund Dividend | Alaska, U.S. | 667,047 | Annually | $1,000-$2,000 | 1982-Present |
| B-MINCOME | Barcelona, Spain | 1,000 | Monthly | $1,392-$23,324* | 2017-2019 |
| Baby's First Years | New York, U.S. | 1,000 | Monthly | $240-$3,996 | 2017-2022 |
| Baby's First Years | New Orleans, U.S. | 1,000 | Monthly | $240-$3,996 | 2017-2022 |
| Baby's First Years | Omaha, U.S. | 1,000 | Monthly | $240-$3,996 | 2017-2022 |
Many of the programs meet the classical requirements of UBI. Of the 48 basic income programs tallied above, 75% paid out monthly, and 60% were paid out to individuals.
However, for various reasons, not all of these programs follow UBI requirements. For example, 38% of the basic income programs were paid out to households instead of individuals, and many programs have paid out in lump sums or over varying time frames.
Interestingly, the need for better understanding of basic income has resulted in many divergences between programs. Some programs were only targeted at specific groups like South Korea’s Basic Income for Farmers program, while others like the Baby’s First Years program in the U.S. have been experimenting with different dollar amounts in order to evaluate efficiency.
Other experiments based payments made off of the total income of recipients. For example, in the U.S., the Rural Income and New Jersey Income Maintenance Experiments paid out using a negative income tax (return) on earnings, while recipients of Canada’s Ontario Basic Income Pilot received fixed amounts minus 50% of their earned income.
Varying Programs with Varied Results
So is basic income the real deal or a pipe dream? The results are still unclear.
Some, like the initial pilots for Uganda’s Eight program, were found to result in significant multipliers on economic activity and well-being. Other programs, however, returned mixed results that made further experimentation difficult. Finland’s highly-touted pilot program decreased stress levels of recipients across the board, but didn’t positively impact work activity.
The biggest difficulty has been in keeping programs going and securing funding. Ontario’s three-year projects were prematurely cancelled in 2018 before they could be completed and assessed, and the next stages of Finland’s program are in limbo.
Likewise in the U.S., start-up incubator Y Combinator has been planning a $60M basic income study program, but can’t proceed until funding is secured.
A Post-COVID Future for UBI?
In light of COVID-19, basic income has once again taken center stage.
Many countries have already implemented payment schemes or boosted unemployment benefits in reaction to the pandemic. Others like Spain have used that momentum to launch fully-fledged basic income pilots.
It’s still too early to tell if UBI will live up to expectations or if the idea will fizzle out, but as new experiments and policy programs take shape, a growing amount of data will become available for policymakers to evaluate.
MARKETS
The $88 Trillion World Economy in One Chart
The world’s total GDP crested $88 trillion in 2019—but how are the current COVID-19 economic contractions affecting its future outlook?
Published
3 weeks agoon
September 14, 2020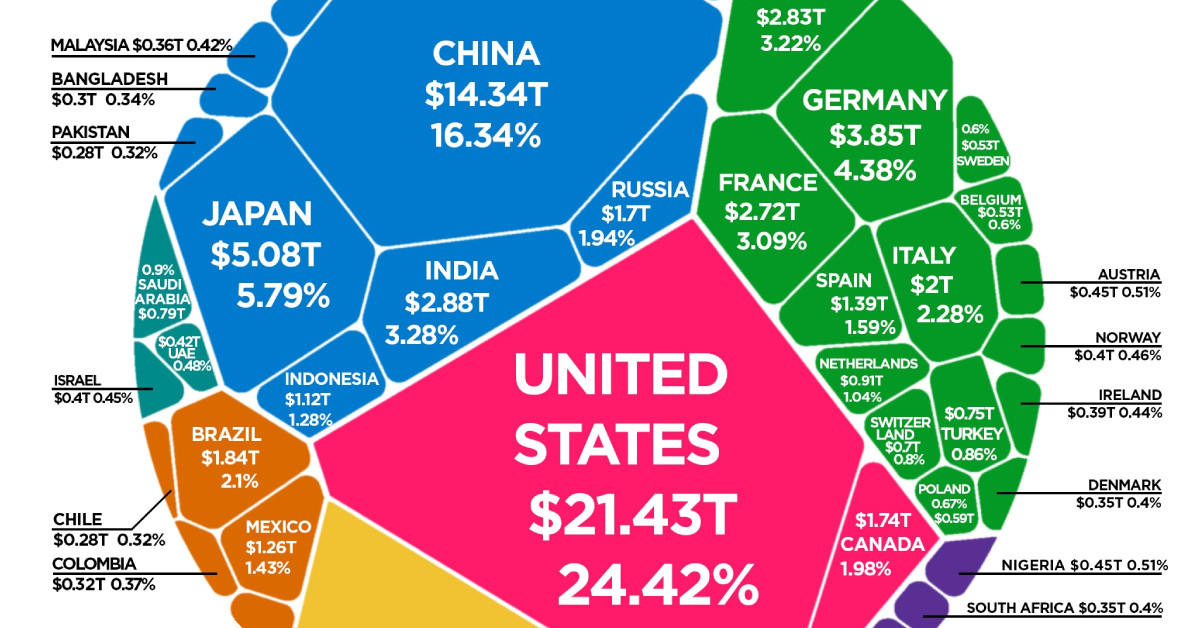
The $88 Trillion World Economy in One Chart
The global economy can seem like an abstract concept, yet it influences our everyday lives in both obvious and subtle ways. Nowhere is this clearer than in the current economic state amid the throes of the pandemic.
This voronoi-style visualization from HowMuch relies on gross domestic product (GDP) data from the World Bank to paint a picture of the global economy—which crested $87.8 trillion in 2019.
Editor’s note: Annual data on economic output is a lagging indicator, and is released the following year by organizations such as the World Bank. The figures in this diagram provide a snapshot of the global economy in 2019, but do not necessarily represent the impact of recent developments such as COVID-19.
Top 10 Countries by GDP (2019)
In the one-year period since the last release of official data in 2018, the global economy grew approximately $2 trillion in size—or about 2.3%.
The United States continues to have the top GDP, accounting for nearly one-quarter of the world economy. China also continued to grow its share of global GDP, going from 15.9% to 16.3%.
| Rank | Country | GDP | % of Global GDP |
|---|---|---|---|
| #1 |  U.S. U.S. | $21.4T | 24.4% |
| #2 |  China China | $14.3T | 16.3% |
| #3 |  Japan Japan | $5.1T | 5.8% |
| #4 |  Germany Germany | $3.9T | 4.4% |
| #5 |  India India | $2.9T | 3.3% |
| #6 |  UK UK | $2.8T | 3.2% |
| #7 |  France France | $2.7T | 3.1% |
| #8 |  Italy Italy | $2.0T | 2.3% |
| #9 |  Brazil Brazil | $1.8T | 2.1% |
| #10 |  Canada Canada | $1.7T | 2.0% |
| Top 10 Countries | $58.7 trillion | 66.9% |
In recent years, the Indian economy has continued to have an upward trajectory—now pulling ahead of both the UK and France—to become one of the world’s top five economies.
In aggregate, these top 10 countries combine for over two-thirds of total global GDP.
2020 Economic Contractions
So far this year, multiple countries have experienced temporary economic contractions, including many of the top 10 countries listed above.
The following interactive chart from Our World in Data helps to give us some perspective on this turbulence, comparing Q2 economic figures against those from the same quarter last year.
One of the hardest hit economies has been Peru. The Latin American country, which is about the 50th largest in terms of GDP globally, saw its economy contract by 30.2% in Q2 despite efforts to curb the virus early.
Spain and the UK are also feeling the impact, posting quarterly GDP numbers that are 22.1% and 21.7% smaller respectively.
Meanwhile, Taiwan and South Korea are two countries that may have done the best at weathering the COVID-19 storm. Both saw minuscule contractions in a quarter where the global economy seemed to grind to a halt.
Projections Going Forward
According to the World Bank, the global economy could ultimately shrink 5.2% in 2020—the deepest cut since WWII.
See below for World Bank projections on GDP in 2020 for when the dust settles, as well as the subsequent potential for recovery in 2021.
| Country/ Region / Economy Type | 2020 Growth Projection | 2021E Rebound Forecast |
|---|---|---|
| United States | -6.1% | 4.0% |
| Euro Area | -9.1% | 4.5% |
| Advanced economies | -7.0% | 3.9% |
| Emerging economies | -2.5% | 4.6% |
| East Asia and Pacific | -0.5% | 6.6% |
| Europe and Central Asia | -4.7% | 3.6% |
| Latin America and the Caribbean | -7.2% | 2.8% |
| Middle East and North Africa | -4.2% | 2.3% |
| South Asia | -2.7% | 2.8% |
| Sub-Saharan Africa | -2.8% | 3.1% |
| Global Growth | -5.2% | 4.2% |
Source: World Bank Global Economic Prospects, released June 2020
POPULAR
 TECHNOLOGY2 months ago
The World’s Tech Giants, Ranked by Brand Value
 TECHNOLOGY2 months ago
AIoT: When Artificial Intelligence Meets the Internet of Things
 TECHNOLOGY1 month ago
Visualizing the Social Media Universe in 2020
 TECHNOLOGY2 weeks ago
Here’s What Happens Every Minute on the Internet in 2020
 TECHNOLOGY1 month ago
Ranked: The Most Popular Websites Since 1993
 DEMOGRAPHICS4 weeks ago
The World Population in 2100, by Country
 BUSINESS2 months ago
From Bean to Brew: The Coffee Supply Chain
 MARKETS2 months ago
The 20 Most and Least Profitable Companies, Per Employee


