MARKETS
The 20 Most and Least Profitable Companies, Per Employee
Published
2 months agoon
August 7, 2020By
Iman Ghosh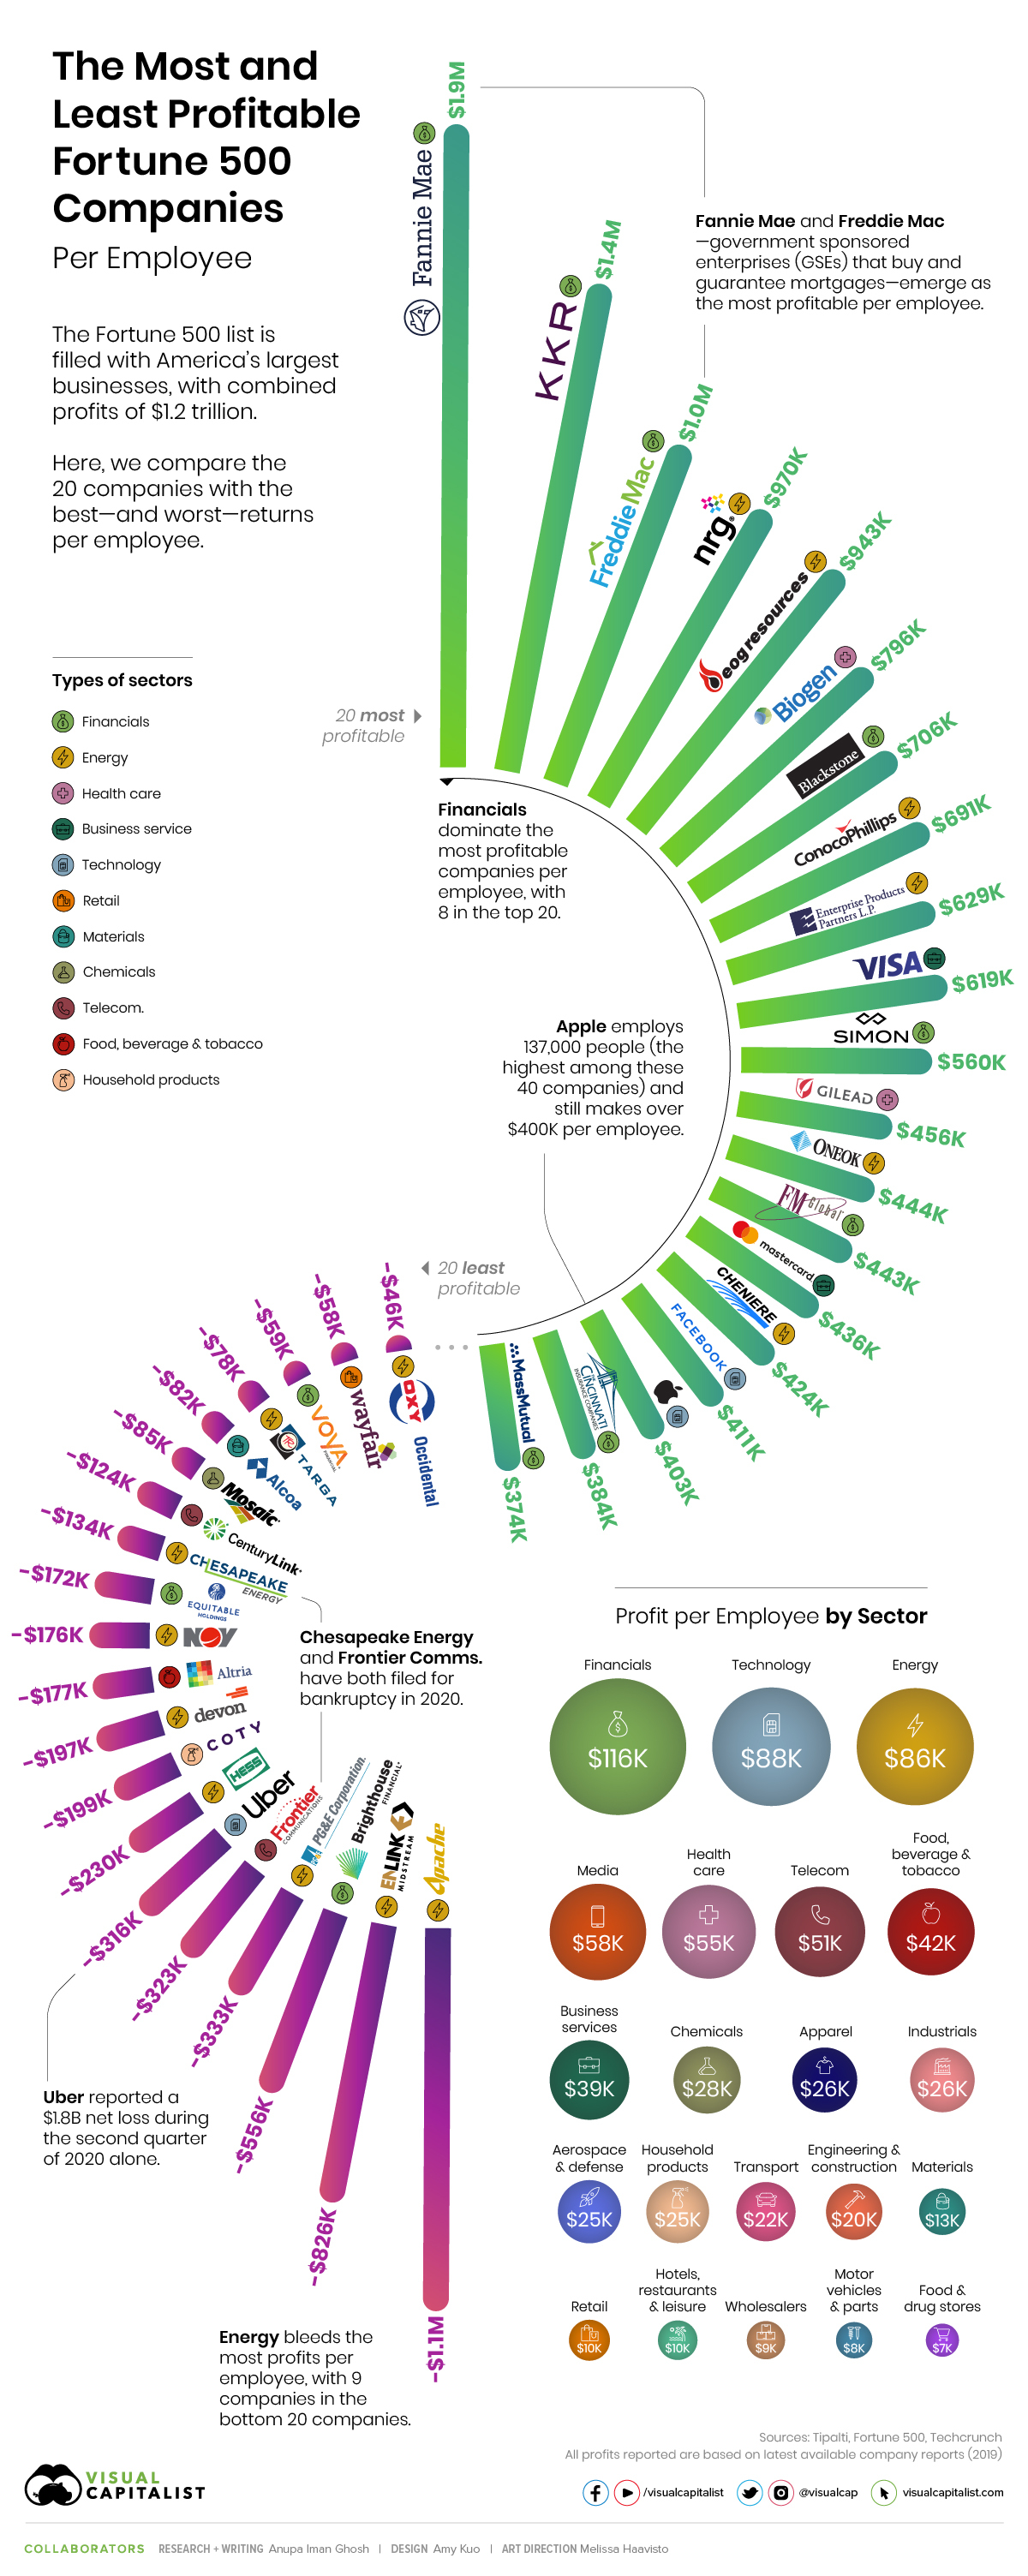
The 20 Most and Least Profitable Companies, Per Employee
The Fortune 500 is an elite club of the biggest American businesses, which combined to generate profits of over $1.2 trillion in 2019.
But how much profit do these companies make on a per employee basis?
This visualization uncovers the answer by comparing the 20 companies with the most and least returns per employee, using calculations from Tipalti (based on the Fortune 500 list).
Top 20: Most Profit per Employee
Diving right in, the companies that make the most money per employee may surprise you.
Housing giants Fannie Mae and Freddie Mac take two of the top three spots, bringing in $1.9 million and $1.0 million per employee respectively in 2019.
The two U.S. government sponsored enterprises (GSEs) are major players in the secondary mortgage market, buying and repackaging nearly half the mortgages in the country. The duo was allowed to retain their profits as of October 2019, instead of returning them to the U.S. Treasury.
| Company | Sector | Profit per Employee | Profits ($M) | Employees |
|---|---|---|---|---|
| Fannie Mae (Federal National Mortgage Association) | Financials | $1,888,000 | $14,160 | 7,500 |
| KKR | Financials | $1,448,699 | $2,005 | 1,384 |
| Freddie Mac (Federal Home Loan Mortgage Corporation) | Financials | $1,046,721 | $7,214 | 6,892 |
| NRG Energy | Energy | $969,631 | $4,438 | 4,577 |
| EOG Resources | Energy | $943,103 | $2,735 | 2,900 |
| Biogen | Health Care | $795,811 | $5,889 | 7,400 |
| Blackstone Group | Financials | $705,680 | $2,050 | 2,905 |
| ConocoPhillips | Energy | $691,250 | $7,189 | 10,400 |
| Enterprise Products Partners | Energy | $628,904 | $4,591 | 7,300 |
| Visa | Business Services | $619,487 | $12,080 | 19,500 |
Apple employs 137,000 people—the largest workforce by far among the 40 companies profiled—but still makes $403,328 per employee. Facebook is the only other tech giant to bring in more money per employee at $411,308.
Bottom 20: Least Profit per Employee
On the other end of the spectrum, Uber is one of the most well-known companies currently bleeding profits, losing $316K per employee. In fact, the ride-hailing service lost approximately $1.8 billion in the second quarter of 2020 alone.
| Company | Sector | Profit per Employee | Profits ($M) | Employees |
|---|---|---|---|---|
| Apache | Energy | -$1,123,301 | -$3,553 | 3,163 |
| EnLink Midstream | Energy | -$825,830 | -$1,119 | 1,355 |
| Brighthouse Financial | Financials | -$556,391 | -$740 | 1,330 |
| PG&E | Energy | -$332,870 | -$7,656 | 23,000 |
| Frontier Communications | Telecommunications | -$322,706 | -$5,911 | 18,317 |
| Uber Technologies | Technology | -$316,208 | -$8,506 | 26,900 |
| Hess | Energy | -$229,859 | -$408 | 1,775 |
| Coty | Household Products | -$199,158 | -$3,784 | 19,000 |
| Devon Energy | Energy | -$197,222 | -$355 | 1,800 |
| Altria Group | Food, Beverages & Tobacco | -$177,123 | -$1,293 | 7,300 |
COVID-19 has also had an intense effect on some of the companies at the bottom end of the profit per employee spectrum. Chesapeake Energy and Frontier Communications are just two examples that have filed for Chapter 11 bankruptcy in recent months—they each lost $134K and $322K per employee in 2019 respectively.
I’m pretty confident we will see more bankruptcies than in any business person’s lifetime.
—James Hammond, CEO of BankruptcyData
Profit per Employee by Sector
When all the companies in the Fortune 500 are taken into account, sector-specific numbers reveal interesting trends.
Financials bring in the most profit per employee at $116K, while Food and Drug Stores see 17 times less profit at $6.7K per employee. In fact, eight out of the top 20 most profitable companies are found in the financial sector.
| Sector | Profits per Employee | Profits ($M) | Employees |
|---|---|---|---|
| Financials | $116,228 | $378,445 | 3,256,067 |
| Technology | $87,532 | $252,836 | 2,888,490 |
| Energy | $85,547 | $75,410 | 881,505 |
| Media | $57,947 | $21,634 | 373,333 |
| Health Care | $54,679 | $145,166 | 2,654,872 |
| Telecommunications | $50,636 | $38,251 | 755,417 |
| F&B incl. Tobacco | $41,946 | $42,924 | 1,023,317 |
| Business Services | $39,354 | $36,835 | 936,000 |
| Chemicals | $27,977 | $11,328 | 404,888 |
| Apparel | $26,154 | $7,776 | 297,300 |
| Industrials | $25,827 | $27,006 | 1,045,675 |
Interestingly, as a whole, the energy sector comes in third place in terms of profit per employee at $86K—that said, nine out of the bottom 20 least profitable companies are also found in this highly volatile industry.
Though the vast majority of businesses impacted by COVID-19 have been small to mid-sized companies, the above calculations also show that Fortune 500 companies are not safe, either.
YOU MAY LIKE

Mapped: The Top Podcasts on Spotify Across Countries

Here’s What Happens Every Minute on the Internet in 2020

Ranked: The Most Popular Websites Since 1993

Visualizing the Social Media Universe in 2020
By the Numbers: Are Tech IPOs Worth the Hype?
The Stocks to Rule Them All: Big Tech’s Might in Five Charts
MARKETS
The New Rules of Leadership: 5 Forces Shaping Expectations of CEOs
This infographic delves into five major forces reshaping our world and the new rules of leadership that CEOs should follow as a result.
Published
1 week agoon
September 23, 2020
It’s common knowledge that CEOs assume a long list of roles and responsibilities.
But in today’s world, more and more people rely on them to go beyond their day-to-day responsibilities and advocate for broader social change. In fact, a number of external forces are changing how leaders are now expected to behave.
How can leaders juggle these evolving expectations while successfully leading their companies into the future?
The New Rules of Leadership
This infographic from bestselling author Vince Molinaro explores five drivers reshaping our world that leaders must pay attention to in order to bring about real change.

How is the World Being Reshaped?
Leaders need to constantly stay one step ahead of the transformative forces that impact businesses on a broader scale.
Below we outline five key drivers that are changing what it means to be a leader in today’s world:
1. Transformative Technologies
Over the last number of decades, several technologies have emerged that could either accelerate the disruption of companies, or provide them with new opportunities for growth. According to KPMG, 72% of CEOs believe the next three years will be more critical for their industry than the previous 50 years.
For example, artificial intelligence (AI), can now provide companies with insights into what motivates their employees and how they can help them succeed. IBM’s AI predictive attrition program can even predict when employees are about to quit—saving them roughly $300 million in retention costs.
Leaders must accept that the future will be mediated by technology, and how they respond could determine whether or not their organization survives entirely.
2. Geopolitical Instability
Geopolitical risks—such as trade disputes or civil unrest—can have a catastrophic impact on a business’s bottom line, no matter its industry. Although 52% of CEOs believe the geopolitical landscape is having a significant impact on their companies, only a small portion say they have taken active steps to address these risks.
By being more sensitive to the world around them, leaders can anticipate and potentially mitigate these risks. Extensive research into geopolitical trends and leveraging the appropriate experts could support a geopolitical risk strategy, and alleviate some of the potential repercussions.
3. Revolutionizing the Working Environment
As the future of work looms, leaders are being presented with the opportunity to reimagine the inner workings of their company. But right now, they are fighting against a wide spectrum of predictions around what they should expect, with estimations surrounding the automation risk of jobs ranging from 5% to 61% as a prime example.
While physical, repetitive, or basic cognitive tasks carry a higher risk of automation, the critical work that remains will require human interaction, creativity, and judgment.
Leaders should avoid getting caught up in the hype regarding the future of work, and simply focus on helping their employees navigate the next decade.
By creating an inspiring work environment and investing in retraining and reskilling, leaders can nurture employee well-being and create a sense of connectedness and resilience in the workplace.
4. Delivering Diversity
Diversity and inclusion can serve as a path to engaging employees, and leaders are being asked to step up and deliver like never before. A staggering 77% of people feel that CEOs are responsible for leading change on important social issues like racial inequality.
But while delivering diversity, equity, and inclusion seems to be growing in importance, many companies are struggling to understand the weight of this issue.
An example of this is Noah’s Ark Paradox, which describes the belief that hiring “two of every kind” creates a diverse work environment. In reality, this creates a false sense of inclusion because the voices of these people may never actually be heard.
Modern day leaders must create a place of belonging where everyone—regardless of gender, race, sexual orientation, ability, or age—is listened to.
5. Repurposing Corporations
The drivers listed above ladder up to the fact that society is looking to businesses to help solve important issues, and leaders are the ones being held accountable.
With 84% of people expecting CEOs to inform conversations and policy debates on one or more pressing issues, from job automation to the impact of globalization, CEOs have the potential to transform their organization by galvanizing employees on the topics that matter to them.
For a long time, the purpose of corporations was purely to create value for shareholders. Now, leaders are obligated to follow a set of five commitments:
- Deliver value to customers
- Invest in employees
- Deal fairly and ethically with suppliers
- Support communities
- Generate long-term value for shareholders
Ultimately, these five commitments build currency for trust, which is critical for sustained growth and building a productive and satisfied workforce.
Lead the Future
If leaders understand the context they operate in, they can identify opportunities that could fuel their organization’s growth, or alternatively, help them pivot in the face of impending threats.
But organizations must invest in the development of their leaders so that they can see the bigger picture—and many are failing to do so.
By recognizing the new rules of leadership, CEOs and managers can successfully lead their organizations, and the world, into a new and uncertain future.
MARKETS
3D Map: The U.S. Cities With the Highest Economic Output
The total U.S. GDP stands at a whopping $21 trillion, but which metro areas contribute to the most in terms of economic output?
Published
1 week agoon
September 22, 2020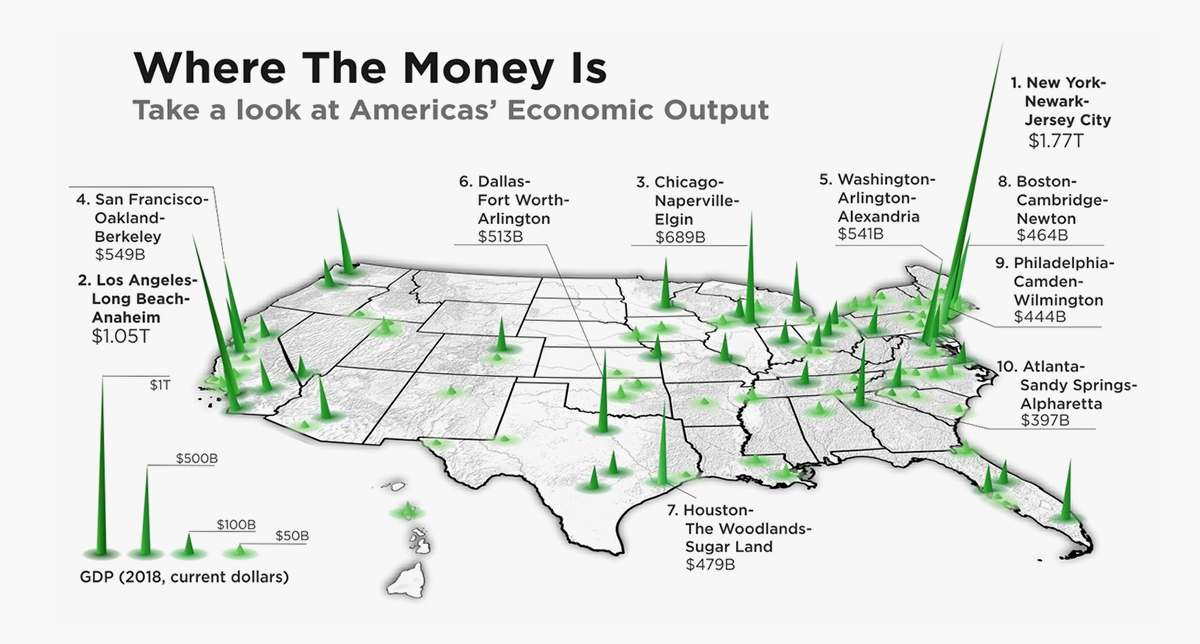
3D Map: The U.S. Cities With the Highest Economic Output
At over $21 trillion, the U.S. holds the title of the world’s largest economy—accounting for almost a quarter of the global GDP total. However, the fact is that a few select cities are responsible for a large share of the country’s total economic output.
This unique 3D map from HowMuch puts into perspective the city corridors which contribute the most to the American economy at large.
Top 10 Metros by Economic Output
The visualization pulls the latest data from the U.S. Bureau of Economic Analysis (BEA, 2018), and ranks the top 10 metro area economies in the country.
One thing is immediately clear—the New York metro area dwarfs all other metro area by a large margin. This cluster, which includes Newark and Jersey City, is bigger than the metro areas surrounding Los Angeles and Chicago combined.
| Rank | Metro Area | State codes | GDP (2018) |
|---|---|---|---|
| #1 | New York-Newark-Jersey City | NY-NJ-PA | $1.77T |
| #2 | Los Angeles-Long Beach-Anaheim | CA | $1.05T |
| #3 | Chicago-Naperville-Elgin | IL-IN-WI | $0.69T |
| #4 | San Francisco-Oakland-Berkeley | CA | $0.55T |
| #5 | Washington-Arlington-Alexandria | DC-VA-MD-WV | $0.54T |
| #6 | Dallas-Fort Worth-Arlington | TX | $0.51T |
| #7 | Houston-The Woodlands-Sugar Land | TX | $0.48T |
| #8 | Boston-Cambridge-Newton | MA-NH | $0.46T |
| #9 | Philadelphia-Camden-Wilmington | PA-NJ-DE-MD | $0.44T |
| #10 | Atlanta-Sandy Springs-Alpharetta | GA | $0.40T |
| Total GDP | $6.90T |
Coming in fourth place is San Francisco on the West Coast, with $549 billion in total economic output each year. Meanwhile in the South, the Dallas metroplex brings in $478 billion, placing it sixth in the ranks.
It’s worth noting that using individual metro areas is one way to view things, but geographers also think of urban life in broader terms as well. Given the proximity of cities in the Northeast, places like Boston, NYC, and Washington, D.C. are sometimes grouped into a single megaregion. When viewed this way, the corridor is actually the world’s largest in economic terms.
U.S. States: Sum of Its Parts
Zooming out beyond just these massive cities demonstrates the combined might of the U.S. in another unique way. Tallying all the urban and rural areas, every state economy can be compared to the size of entire countries.

According to the American Enterprise Institute, the state of California brings in a GDP that rivals the United Kingdom in its entirety.
By this same measure, Texas competes with Canada in terms of pure economic output, despite a total land area that’s 15 times less that of the Great White North.
With COVID-19 continuing to impact parts of the global economy disproportionately, how will these kinds of economic comparisons hold up in the future?
POPULAR
 TECHNOLOGY2 months ago
The World’s Tech Giants, Ranked by Brand Value
 TECHNOLOGY2 months ago
AIoT: When Artificial Intelligence Meets the Internet of Things
 TECHNOLOGY1 month ago
Visualizing the Social Media Universe in 2020
 TECHNOLOGY2 weeks ago
Here’s What Happens Every Minute on the Internet in 2020
 TECHNOLOGY1 month ago
Ranked: The Most Popular Websites Since 1993
 DEMOGRAPHICS4 weeks ago
The World Population in 2100, by Country
 BUSINESS2 months ago
From Bean to Brew: The Coffee Supply Chain
 MARKETS2 months ago
How the S&P 500 Performed During Major Market Crashes


