Women
Mapped: The Richest Women in the World (Updated October 2020)
Mapped: The Richest Women in the World (Updated October 2020)
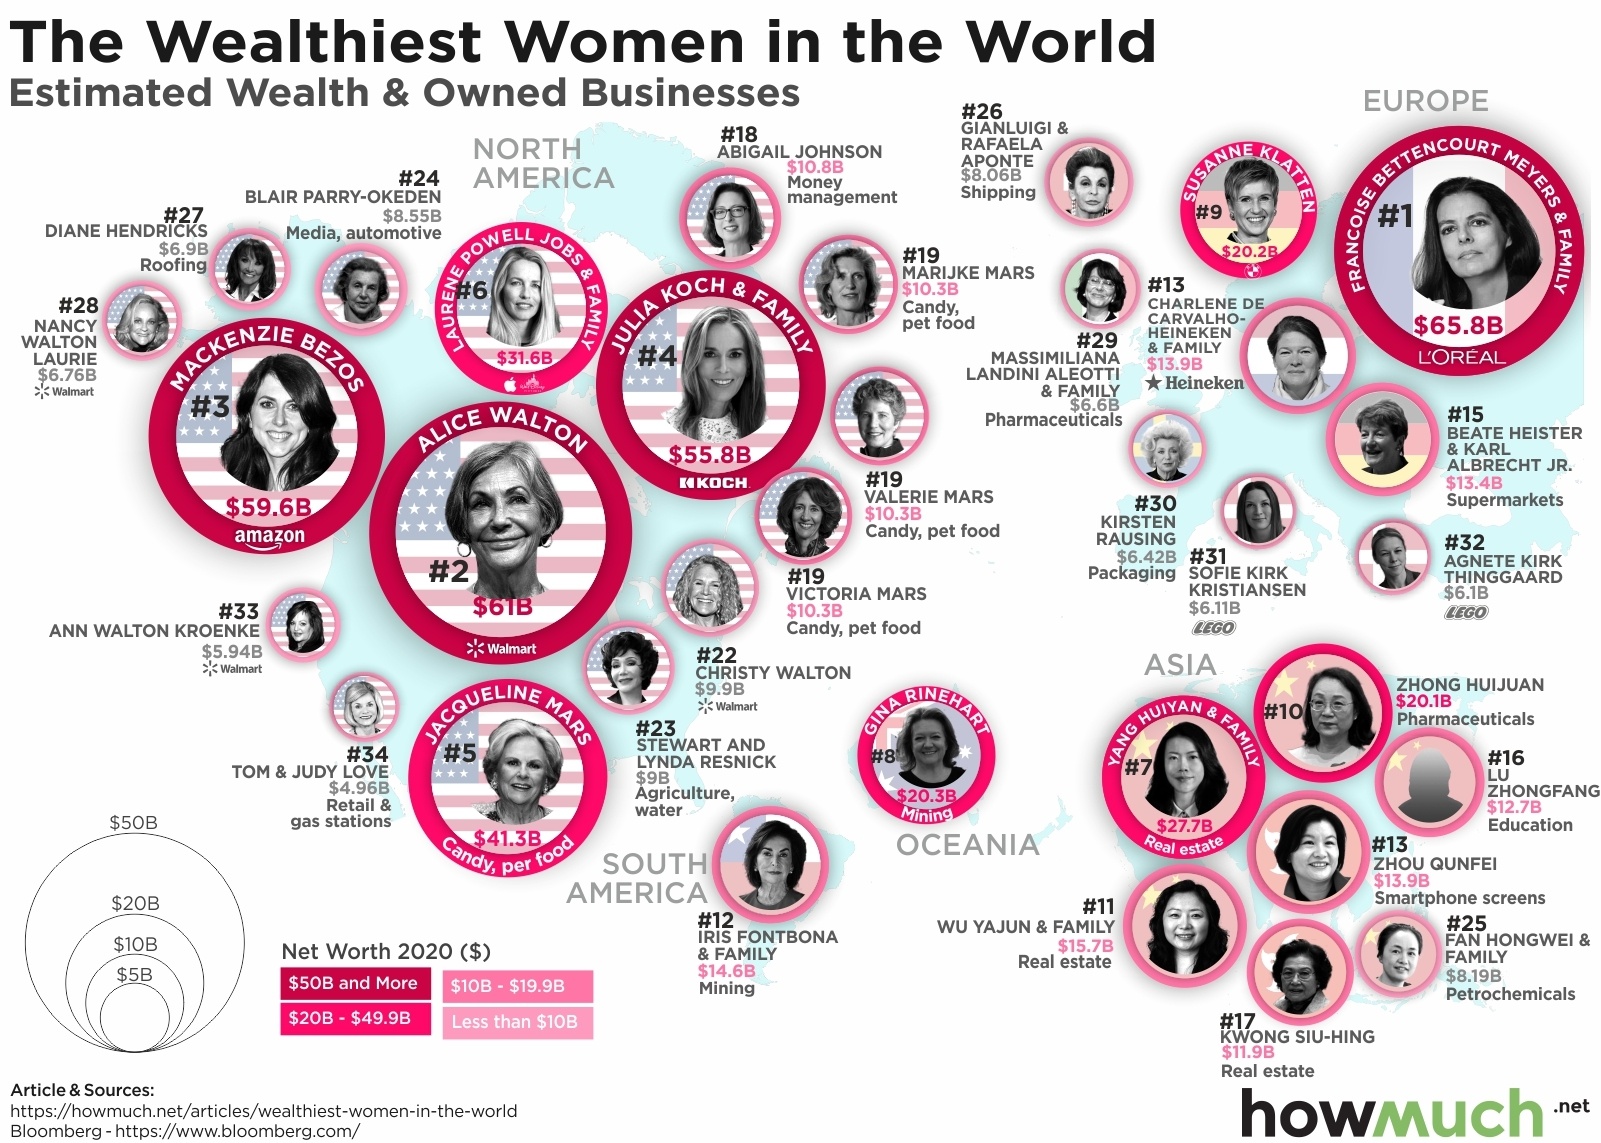
Last month, 2,095 individuals earned the honor of appearing on Forbes’ World Billionaires List. In some of our recent visualizations, we’ve used this list to map out the richest person in each country and in each state. But if you take a closer look, you’ll notice a pattern--most of them are men! But what about the richest women in the world? That’s the subject of our latest visualization, which illustrates where the world’s richest women in the world, how much they are worth, and in which industry they acquired their wealth.

Francoise Bettencourt Meyers — granddaughter of L'Oreal's founder — is now the wealthiest woman in the world as of October 2020.
Our data comes from Bloomberg Billionaires Index. The circles around the map represent the top 35 richest women in the world, with her rank on the list of the richest women, her photo, her net worth, and the flag representing her country. The circles are also color-coded, with a darker shade of pink indicating a larger net worth. Similarly, the larger circles correspond to greater wealth. Each circle also lists the individual’s associated industry or company. All values are expressed in U.S. dollars.
Top 10 Richest Women in the World
1. Francoise Bettencourt Meyers & Family: $65.9 billion
2. Alice Walton: $61 billion
3. Mackenzie Bezos: $59.6 billion
4. Julia Koch & Family: $55.8 billion
5. Jacqueline Mars: $41.3 billion
6. Laurene Powell Jobs & Family: $31.6 billion
7. Yang Huiyan & Family: $27.7 billion
8. Gina Rinehart: $20.3 billion
9. Susanne Klatten: $20.2 billion
10. Zhong Huijuan: $20.1 billion
The richest women in the world represent several industries, including fashion & retail, food & beverage, and real estate. In addition, a few famous families are represented in the visualization. For example, five of the top 35 women are from the Mars family (of candy-making fame). Similarly, both Alice and Christy Walton are heirs to the Walmart fortune.
A notable newcomer to the list is MacKenzie Bezos, the ex-wife of Amazon founder Jeff Bezos (who also has the distinction of the richest person in the world). As part of their divorce settlement in 2019, MacKenzie received 25% of Jeff's Amazon stake, or 4% of the company.
As the stock market’s current volatility affects billionaires’ fortunes, how do you think this list will change in the near future? Let us know in the comments.
Do you need insurance for your business? Don't worry, we've got you covered.
Check Our Business Insurance Guides
General Liability Insurance Cost
Errors & Omissions Insurance Cost
Legal Malpractice Insurance Cost
Business Insurance Cost for Startups
Medical Malpractice Insurance Cost
Commercial Property Insurance Cost
Product Liability Insurance Cost
Comments
The Largest Brands of the World 2020
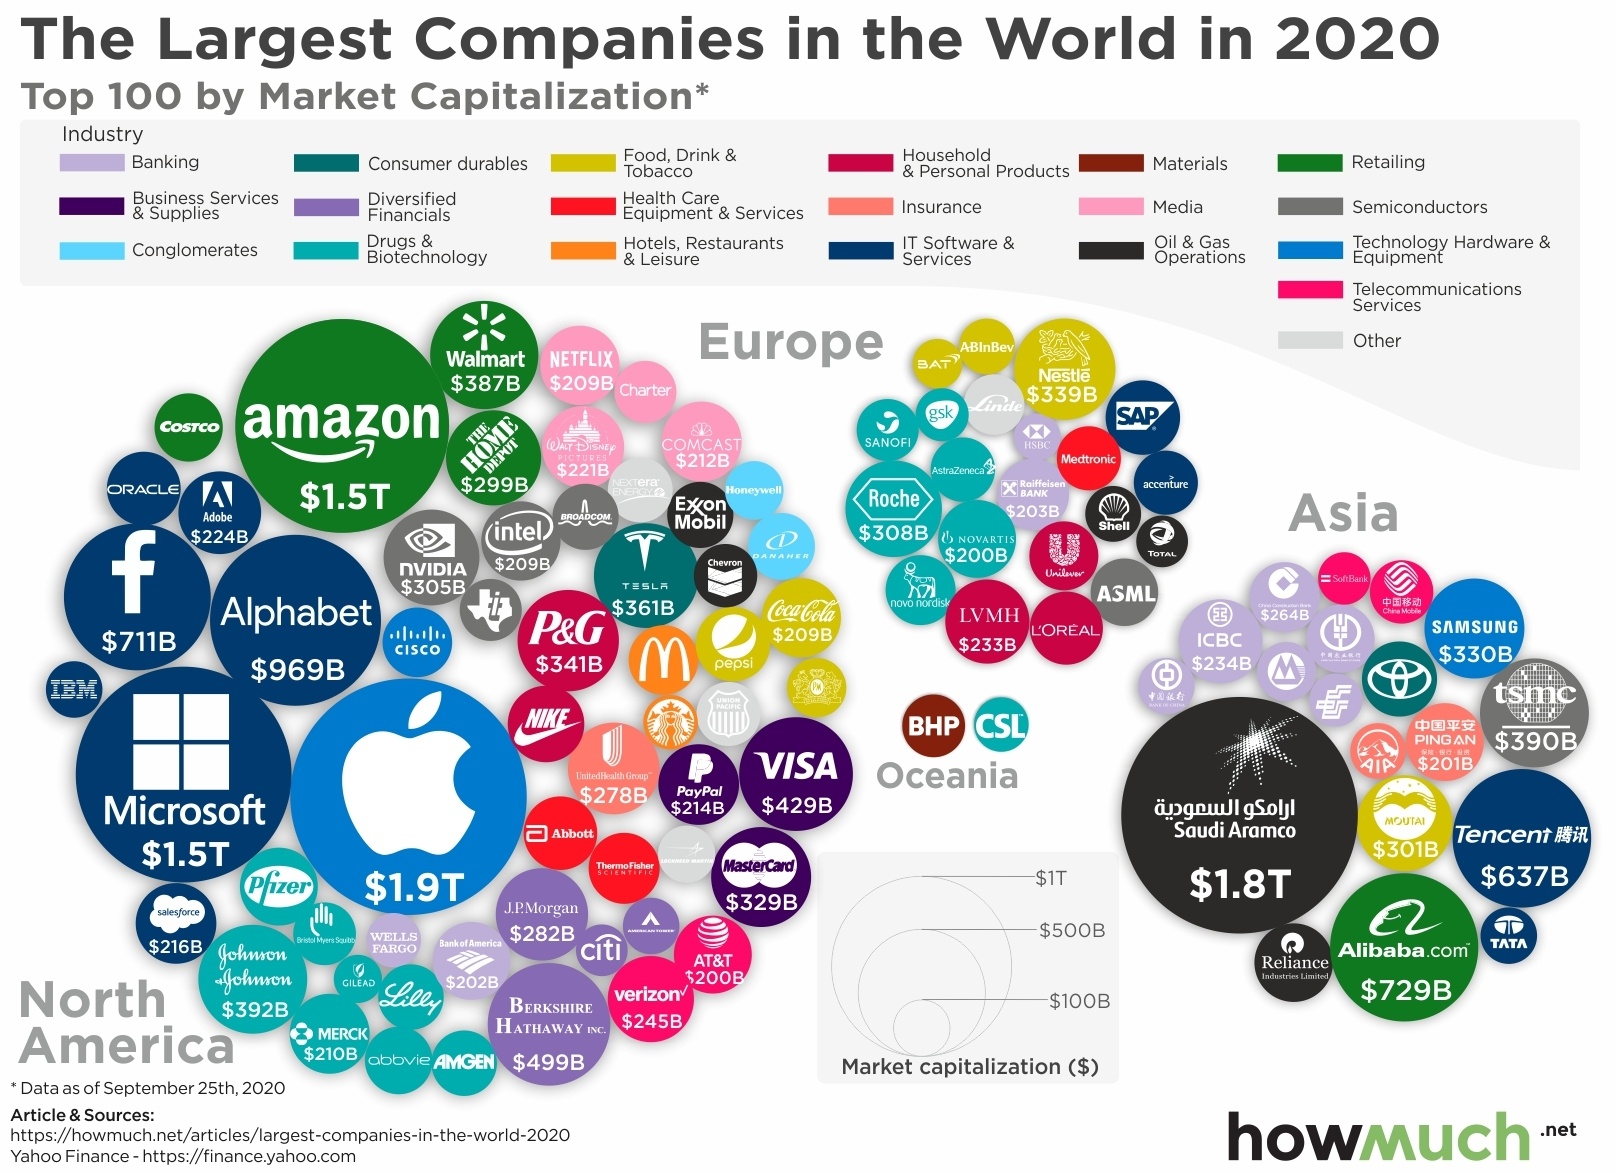
Market capitalization is one of the best ways to easily measure a company’s value. First, figure out how many shares a company has on the stock market. Then, multiply that by the price of the stock. As the share price rises and falls throughout the year, the company’s total value also moves up and down. And the 100 most valuable companies in the world aren’t all high-flying tech companies, as our latest visualization makes clear.

Apple is the largest company in the world as of this writing, topping $1.9T in total market capitalization. That’s more than Saudi Aramco, the second most valuable company in the world at $1.8T.
The US dominates the list of top 100, led by a handful of trillion dollar tech companies like Microsoft ($1.5T), Amazon ($1.5T), Alphabet ($969B) and Facebook ($711B).
The US also produces a wide variety of companies in the top 100 representing different industries like financial services, physical retail and restaurants. That compares to the relative lack of diversity in Asia.
South America and Africa are totally absent from our visual, demonstrating just how far the Southern Hemisphere has to go to catch up with the industrialized economies of the world.
We grabbed the top 100 companies by market capitalization from Forbes as of September 25, 2020. We sized each bubble according to its USD market cap and added a color to indicate the underlying industry, creating a nice snapshot of the global economy in 2020.
Top 10 Largest Brands of the World by Market Cap in 2020
1. Apple (US): $1.9T
2. Saudi Aramco (Saudi Arabia): $1.8T
3. Microsoft (US): $1.5T
4. Amazon (US): $1.5T
5. Alphabet (US): $969B
6. Alibaba (China) $729B
7. Facebook (US): $711B
8. Tencent Holdings (China) $637B
9. Berkshire Hathaway (US): $499B
10. Visa (US): $429B
One of the most obvious insights from our visual is just how dominant the American economy is in producing large mega corporations with enormous market capitalizations. The US boasts three companies with a total value of over $1T, including Apple ($1.9T), Microsoft ($1.5T) and Amazon ($1.5T). There are also several notable companies worth several hundreds of billions of dollars, like Alphabet which owns Google ($969B) and Facebook ($711B). In fact, there are only two companies from China in the top 10, Alibaba ($729B) and Tencent Holdings ($637B). That being said, Asia has more collective market cap than Europe across the top 100 companies in the world thanks in large part to Saudi Aramco ($1.8T). We should also note how both South America and Africa are entirely missing because neither continent has any company with a market cap in the top 100.
Another way to look at our visual is to slice it by industry. There is a lot of diversity across North America, with the largest tech companies balanced by a variety of other industries. Johnson & Johnson ($392B) is a major player in the drug and biotechnology industry. Walmart ($387B) and Home Depot ($299B) are the giants in physical retail. There’s also a collection of American banks, financial services, healthcare and restaurant chains too. Compare that to the relative lack of diversity across Asia, where an oil company dominates, followed by banks and only one or two companies from a couple other industries. Clearly the US economy not only produces more mega-winners overall, but scale and size are spread across industries too.
There are two important limitations about our visualization. First, not every company actually has this much stock listed for sale on public exchanges. For example, Saudi Aramco listed its shares for the first time in December 2019. However, the company only made available the equivalent of 1.5% of its shares to the public, meaning the vast majority of the company remains in the control of Saudi Arabia’s government. Those shareholders could always sell their shares later. And second, the stock market is in a constant state of flux right now. Market volatility is very high right now due to uncertainty around the presidential election and coronavirus fears. Apple recently shot above a $2T valuation before coming back down. The six biggest tech stocks together lost more than $1T in value in just three days. In short, our visual could look very different by the end of the year than it does today.
Which company do you think will be the most valuable after the coronavirus pandemic ends? Let us know in the comments.
Comments
Visualizing the Richest Cities in the US
It’s no secret the US economy is powered by cities. The coronavirus forced several major metro areas into lockdowns, halting all nonessential in-person activities and sending unemployment to historic highs. With many states now reconsidering lockdowns, we thought it would be time to measure just how important American cities are to the national GDP.

The greater New York City metro area has by far the largest GDP of any American city at $1.77T. That’s larger than the whole economies of several countries.
Los Angeles just recently surpassed $1T in total economic output, making it the second biggest metro area by GDP.
San Francisco has seen rapid economic growth, shooting up from $406B just a couple years ago to $549B in this visual.
It remains to be seen exactly how the coronavirus will impact the American economy as tech workers who can do their jobs from anywhere consider moving to cheaper locations.
We got the data for our visual from the US Bureau of Economic Analysis for 2018, the latest year complete data were available. We created a 3D map where spikes indicate the gross domestic product (GDP) of each metro area, adjusted for inflation to 2020. The result is an intuitive snapshot of the geography of the American economy on the eve of the coronavirus disruptions.
Top 10 Richest Cities in the US - GDP by Metro Area
1. New York: $1.77T
2. Los Angeles: $1.05T
3. Chicago: $689B
4. San Francisco: $549B
5. Washington, DC: $541B
6. Dallas: $513B
7. Houston: $479B
8. Boston: $464B
9. Philadelphia: $444B
10. Atlanta: $397B
Our map reveals how the country’s economic output is concentrated in a select number of metro areas. New York stands head and shoulders above the rest, generating $1.77T in GDP each year, far ahead of second place Los Angeles at $1.05T. The greater New York area has a larger economy than all of Russia. A lot of these cities have larger economies than entire countries, as our previous analysis showed. The top 10 metros alone account for over 37% of the entire economic output for all American metros, or about $6.15T. That’s so big, if these cities left the US and formed their own country, it would have the third largest economy in the world.
To put our map in context, the top metro areas have seen their economies substantially grow over the last few years. New York’s GDP increased from $1.43T in 2016 (not adjusting for inflation) to approximately $1.77 (as of 2018 adjusted to 2020). Los Angeles similarly went from $885B to $1.05T. But San Francisco experienced the most growth relative to other cities, catapulting from seventh to fourth and going from $406B to $549B. That’s north of 35% growth in just a couple years.
One of the most interesting ways to think about this type of analysis is to consider how the coronavirus is scrambling and reordering the economy. Take San Francisco as an example. Filled with tech workers and software engineers, San Francisco has seen an exodus of people leaving the Bay Area as companies increasingly allow their employees to work remote, sometimes indefinitely. This has put downward pressure for the first time in recent history on real estate and rent prices, instead redistributing workers across the country where the costs of living are a lot lower. This should benefit smaller cities and potentially depress the GDP of major metros.
How do you think the coronavirus is going to change the economic map of the US? Let us know in the comments.
